| Fire incidents reported |
|---|
| Sreet name | Count |
|---|
| ROUTE 9J | 12 | | 9J RT | 10 | | GIBBONS RD | 10 | | CHURCH ST | 8 | | EICHYBUSH ROAD | 8 | | ROUTE 9 | 8 | | RT 9J | 8 | | SCHOOLHOUSE RD | 8 | | SHARPTOWN RD | 8 | | 26A RT | 6 | | OAKLEAF DR | 6 | | PATTS LN | 6 | | REGAL RD | 6 | | RT 9 | 6 | | SHARPTOWN RD | 6 | | 2270 RIVER ROAD SCHODACK | 4 | | ALLEN CIRCLE | 4 | | ALLENDALE RD | 4 | | COUNTY ROUTE 21 | 4 | | COUNTY ROUTE 21 RT | 4 | | EICHYBUSH ROAD RD | 4 | | GIBBONS ROAD | 4 | | GYPSY ROCK RD | 4 | | IMPERIAL LN | 4 | | LANG ROAD WEST | 4 |
| | | Fire incidents reported |
|---|
| Sreet name | Count |
|---|
| PATS LA | 4 | | ROYAL RD | 4 | | RT 9J SOUTH OF LANG ROAD WEST | 4 | | RT. 9 | 4 | | RT. 9J | 4 | | SCISM RD | 4 | | STATE ROUTE 9 | 4 | | SUMMERSET RD | 4 | | 11 OAK LEAF DRIVE | 2 | | 156 RIDGE RD | 2 | | 194 26A | 2 | | 21 RT | 2 | | 2270 RIVER ROAD IN SCHDACK | 2 | | 3716 CTY RT 21 | 2 | | 4092 COUNTY RT 21 | 2 | | 9-J RT | 2 | | 956 RT 9J | 2 | | ALLENDALE ROAD WEST | 2 | | ALVORDS DOCK ROAD RD | 2 | | BRANCH STREET | 2 | | CHURCH STREET | 2 | | CHURCH STREET ST | 2 | | CO RT 21 | 2 | | CORONATION | 2 | | |
|
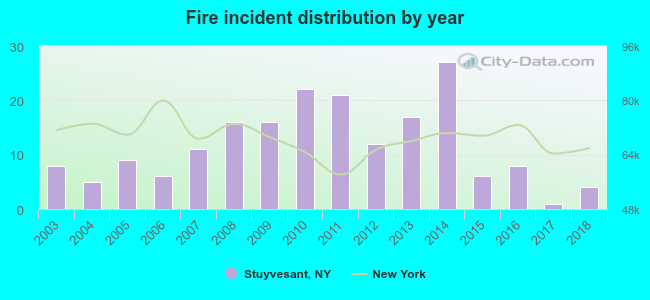 Based on the data from the years 2003 - 2018 the average number of fires per year is 12. The highest number of fire incidents - 27 took place in 2014, and the least - 1 in 2017. The data has a declining trend.
 37.6% incidents where reported in the morning and 62.4% in the evening. The most fires (16.9%) took place on Saturday, and the least (9.5%) on Sunday.
 According to the 189 reports from years 2003 - 2018 most fires (19.0%) took place during April, and the least (2.1%) in October.
 Out of all 662 cases reported during the years 2003 - 2018, the most belonged to the categories: Hazardous Condition (29.2%), Fire (28.5%), and Service Call (14.0%).
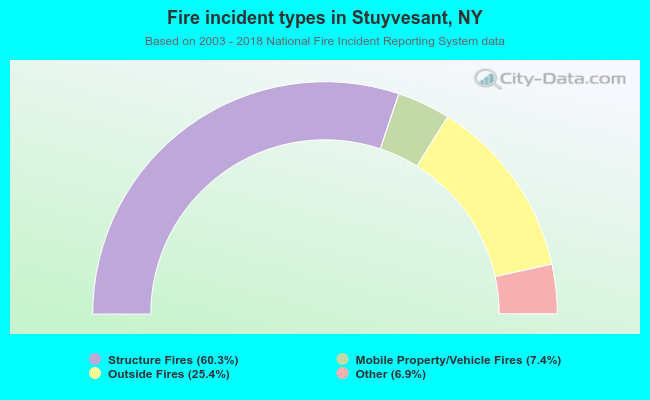 When looking into fire subcategories, the most incidents belonged to: Structure Fires (60.3%), and Outside Fires (25.4%).