| Fire incidents reported |
|---|
| Sreet name | Count |
|---|
| SUDLERSVILLE RD. | 20 | | SUDLERSVILLE RD | 18 | | GOLDSBORO RD | 14 | | MAIN ST | 14 | | BUSIC CHURCH RD | 12 | | CHURCH ST | 12 | | DIXON TAVERN RD | 10 | | GOLDSBORO RD. | 10 | | BENTON CORNER RD. | 8 | | BUSIC CHURCH RD | 8 | | BUSICK CHURCH RD | 8 | | CHURCH ST. | 8 | | DIXON TAVERN RD | 8 | | DUHAMEL CORNER RD. | 8 | | MAIN ST. | 8 | | MAIN STREET | 8 | | 301 | 6 | | BENTON CORNER RD | 6 | | DUHAMEL CORNER RD | 6 | | MILLINGTON RD | 6 | | PETERS CORNER RD. | 6 | | 2509 BUSIC CHURCH RD | 4 | | BARCLAY RD | 4 | | BOLTON WOODS RD. | 4 | | BRUSCA LANE | 4 |
| | | Fire incidents reported |
|---|
| Sreet name | Count |
|---|
| DOWNS CHAPEL | 4 | | DUDLEY'S CORNER RD | 4 | | DUHAMEL CORNER RD | 4 | | GOLDSBORO ROAD | 4 | | HARD WOOD MILLS RD | 4 | | LINDEN ST. | 4 | | MAPLE AVE | 4 | | N CHURCH ST | 4 | | NORTH CHURCH ST | 4 | | NORWOOD DR | 4 | | NORWOOD DR. | 4 | | QA STA 6 | 4 | | SAWMILL RD | 4 | | SOUTH CHURCH ST | 4 | | STULLTOWN RD. | 4 | | SUDLERSVILLE PARK | 4 | | SUDLERSVILLE RD | 4 | | 100 CHURCH ST | 2 | | 1000 HARBOR COURT | 2 | | 1032 PETRES CORNER RD | 2 | | 107 MAIN ST | 2 | | 108 SOUTH LINDEN ST | 2 | | 109 PIERCE RD | 2 | | 1108 BARCLAY RD | 2 | | |
|
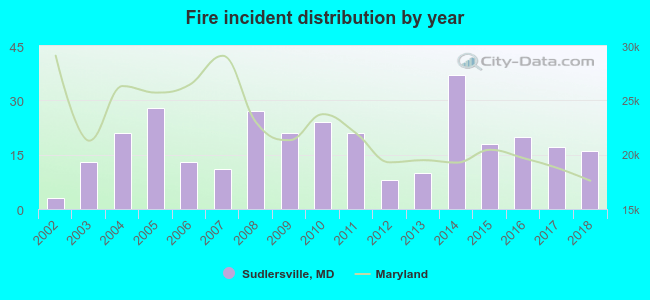 According to the data from the years 2002 - 2018 the average number of fire incidents per year is 18. The highest number of reported fire incidents - 37 took place in 2014, and the least - 3 in 2002. The data has an increasing trend.
 29.2% incidents where reported in the morning and 70.8% in the evening. The most fires (16.9%) took place on Saturday, and the least (10.4%) on Wednesday.
 According to the 308 fire incident reports from years 2002 - 2018 most fires (11.4%) took place during April, and the least (3.6%) in August.
 Out of all 940 cases reported during the years 2002 - 2018, the most belonged to the categories: Fire (32.8%), Rescue & EMS (23.8%), and Good Intent Call (18.2%).
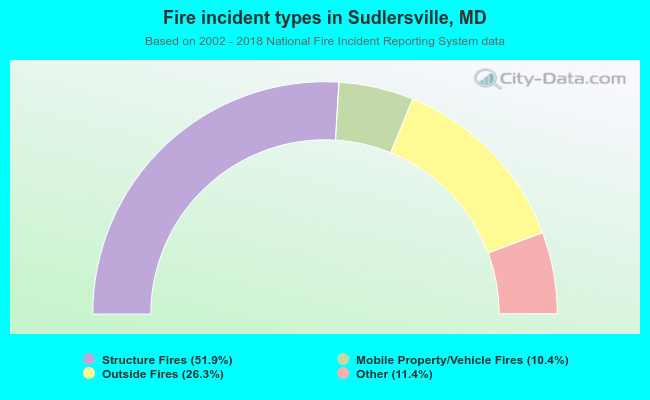 When looking into fire subcategories, the most incidents belonged to: Structure Fires (51.9%), and Outside Fires (26.3%).