Sumas: Fire Incidents, Washington (WA)
Where are fire incidents reported in Sumas, WA
Something went wrong! Please refresh the page.
|
| |||||||||||||||||||||||||||||||||||||||||||||||||||||||||||||||||||||||||||||||||||||||||||||||||||||||||||||
2003 - 2018 National Fire Incident Reporting System (NFIRS) incidents
- Incident types reported to NFIRS in Sumas, WA
- 1,45769.3%Rescue & EMS
- 1677.9%Fire
- 1627.7%Service Call
- 1266.0%Good Intent Call
- 1255.9%Hazardous Condition
- 572.7%False Alarm
- 60.3%Severe Weather
- Fire incident types reported to NFIRS in Sumas, WA
- 6538.9%Structure Fires
- 5734.1%Outside Fires
- 4124.6%Mobile Property/Vehicle Fires
- 42.4%Other
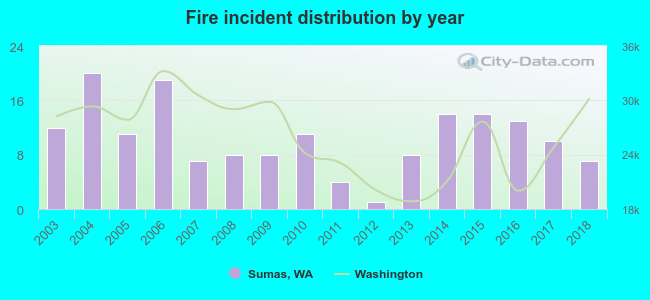 Based on the data from the years 2003 - 2018 the average number of fire incidents per year is 10. The highest number of fires - 20 took place in 2004, and the least - 1 in 2012. The data has a dropping trend.
 28.1% incidents where reported in the morning and 71.9% in the evening. The most fires (19.2%) took place on Tuesday, and the least (8.4%) on Thursday.
 According to the 167 reports from years 2003 - 2018 most fires (13.2%) took place during September, and the least (4.8%) in June.
 Out of all 2,102 cases reported during the years 2003 - 2018, the most belonged to the categories: Rescue & EMS (69.3%), Fire (7.9%), and Service Call (7.7%).
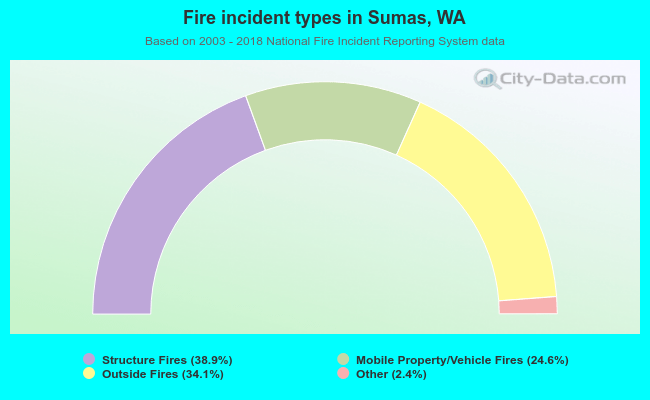 When looking into fire subcategories, the most incidents belonged to: Structure Fires (38.9%), and Outside Fires (34.1%).