Sumter: Fire Incidents, South Carolina (SC)
Where are fire incidents reported in Sumter, SC
Something went wrong! Please refresh the page.
| Fire incidents reported | |
|---|---|
| Sreet name | Count |
| BROAD ST | 508 |
| HWY 15 | 316 |
| LIBERTY ST | 286 |
| BREWINGTON RD | 242 |
| MAIN ST | 242 |
| HWY 378 | 208 |
| PINEWOOD RD | 190 |
| MYRTLE BEACH HWY | 156 |
| GUIGNARD DR | 148 |
| MILLER RD | 136 |
| HWY 521 | 130 |
| BOULEVARD RD | 124 |
| LAFAYETTE DR | 114 |
| HWY 261 | 98 |
| CHERRYVALE DR | 92 |
| PIKE RD | 92 |
| BETHEL CHURCH RD | 88 |
| CAROLINA AVE | 88 |
| SOMERSET DR | 86 |
| HARVIN ST | 82 |
| PEACH ORCHARD RD | 82 |
| CAMDEN HWY | 80 |
| OLD MANNING RD | 80 |
| PLOWDEN MILL RD | 80 |
| CHARLOTTE AVE | 78 |
| CALHOUN ST | 74 |
| KOLB RD | 74 |
| MCCRAY'S MILL RD | 74 |
| TINDAL RD | 70 |
| MANNING AVE | 68 |
| Other | 4,951 |
2003 - 2018 National Fire Incident Reporting System (NFIRS) incidents
- Incident types reported to NFIRS in Sumter, SC
- 9,13736.7%Fire
- 5,32621.4%Good Intent Call
- 5,19920.9%Rescue & EMS
- 2,61110.5%Hazardous Condition
- 1,9828.0%False Alarm
- 4541.8%Service Call
- 1570.6%Severe Weather
- Fire incident types reported to NFIRS in Sumter, SC
- 4,08944.8%Outside Fires
- 3,50638.4%Structure Fires
- 1,44415.8%Mobile Property/Vehicle Fires
- 981.1%Other
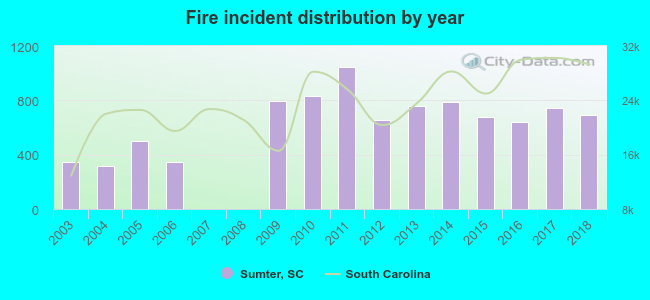 Based on the data from the years 2003 - 2018 the average number of fire incidents per year is 571. The highest number of reported fire incidents - 1,047 took place in 2011, and the least - 0 in 2008. The data has an increasing trend.
The average number of yearly fire incidents per 10k residents in Sumter, SC compared to nearest cities:
(Note: Based on data for the last 3 years, including only cities with population 5,000 and above)
| Sumter: | 169.2 |
| Camden: | 142.2 |
| Lugoff: | 130.0 |
| Hopkins: | 127.9 |
| Hartsville: | 310.7 |
| Lake City: | 190.6 |
| Forest Acres: | 5.2 |
| Columbia: | 115.1 |
| Florence: | 126.4 |
 The median response time based on all reported fire incidents is 6 minutes. This is close to the South Carolina median value.
The median response time in Sumter, SC compared to nearest cities:
(Note: Based on data for all years, including only cities with at least 500 fire incidents)
| Sumter: | 6 minutes |
| Rembert: | 12 minutes |
| Manning: | 7 minutes |
| Lynchburg: | 11 minutes |
| Eastover: | 9 minutes |
| Bishopville: | 10 minutes |
| Summerton: | 7 minutes |
| Camden: | 4 minutes |
| Lugoff: | 7 minutes |
 According to the reports from the years 2003 - 2018 the average number of fire-related fatalities per year is 2. The highest number of reported deaths - 6 took place in 2017, and the lowest - 0 in 2005. The data has a decreasing trend.
The average number of fatalities per 1,000 fires is 3. This indicator was the highest - 8 in 2017, and the lowest 0 in 2005. The trend for fatalities per 1,000 fires is declining. Compared to the South Carolina value the number of fatalities per 1,000 fires is higher.
According to the reports from the years 2003 - 2018 the average number of fire-related fatalities per year is 2. The highest number of reported deaths - 6 took place in 2017, and the lowest - 0 in 2005. The data has a decreasing trend.
The average number of fatalities per 1,000 fires is 3. This indicator was the highest - 8 in 2017, and the lowest 0 in 2005. The trend for fatalities per 1,000 fires is declining. Compared to the South Carolina value the number of fatalities per 1,000 fires is higher.Deaths per 1,000 incidents in Sumter, SC compared to nearest cities:
(Note: Based on data for all years, including only cities with at least 2,500 fire incidents)
| Sumter: | 3.0 |
| Manning: | 0.0 |
| Hartsville: | 4.0 |
| Columbia: | 2.8 |
| Florence: | 2.4 |
| West Columbia: | 1.9 |
| Orangeburg: | 2.0 |
 Based on the data from the years 2003 - 2018 the average number of fire-related yearly casualties is 3. The highest number of injuries - 11 took place in 2003, and the lowest - 0 in 2005. The data has a dropping trend.
The average number of injuries per 1,000 fire incidents is 6. This indicator was the highest - 32 in 2003, and the lowest 0 in 2005. The trend for injuries per 1,000 incidents is declining. Compared to the state value the number of injuries per 1,000 fires is lower.
Based on the data from the years 2003 - 2018 the average number of fire-related yearly casualties is 3. The highest number of injuries - 11 took place in 2003, and the lowest - 0 in 2005. The data has a dropping trend.
The average number of injuries per 1,000 fire incidents is 6. This indicator was the highest - 32 in 2003, and the lowest 0 in 2005. The trend for injuries per 1,000 incidents is declining. Compared to the state value the number of injuries per 1,000 fires is lower.
 27.3% incidents where reported in the morning and 72.7% in the evening. The most fires (15.3%) took place on Saturday, and the least (13.3%) on Thursday.
 Based on the 9,137 fire incident reports from years 2003 - 2018 most fires (12.5%) took place during March, and the least (6.2%) in August.
 Out of all 24,905 cases reported during the years 2003 - 2018, the most belonged to the categories: Fire (36.7%), Good Intent Call (21.4%), and Rescue & EMS (20.9%).
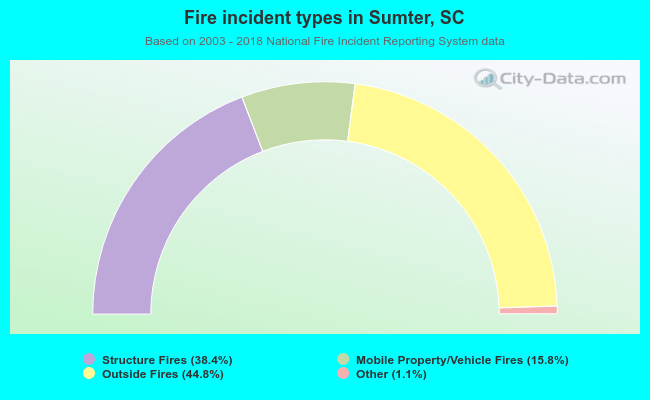 When looking into fire subcategories, the most reports belonged to: Outside Fires (44.8%), and Structure Fires (38.4%).