| Fire incidents reported |
|---|
| Sreet name | Count |
|---|
| MILL CREEK RD | 12 | | BURRVILLE RD | 10 | | DEER LODGE HWY | 10 | | MORGAN COUNTY HWY | 10 | | RED HILL RD | 10 | | BREWSTERTOWN RD | 8 | | BURRVILLE ROAD RD | 8 | | MILL CREEK ROAD RD | 8 | | SUMMERS HILL RD | 8 | | BURRVILLE RD | 6 | | MORGAN CO HWY | 6 | | PEA RIDGE ROAD RD | 6 | | 199 SUMMERS HILL ROAD | 4 | | 276 BROCK ROAD | 4 | | 315 MILL CREEK RD. | 4 | | 735 RED HILL RD. | 4 | | BROCK RD | 4 | | BURRVILLE ROAD | 4 | | DEER LODGE HIGHWAY | 4 | | GLADES | 4 | | GLADES RD | 4 | | HAMBY ROAD | 4 | | JAMES SHANNON RD | 4 | | MELTON DR | 4 | | MILLCREEK | 4 |
| | | Fire incidents reported |
|---|
| Sreet name | Count |
|---|
| MILLCREEK ROAD RD | 4 | | MORGAN COUNTY HWY | 4 | | PEA RIDGE RD | 4 | | PEA RIDGE RD | 4 | | PEA RIDGE ROAD | 4 | | PETERS FORD RD | 4 | | PILOT MOUNTAIN ROAD | 4 | | RED HILL RD | 4 | | VFW RD | 4 | | (US 27) MORGAN COUNTY HWY | 2 | | (US 27) MORGAN HWY | 2 | | 105 VFW RD | 2 | | 1121 BURRVILLE RD | 2 | | 1131 BURRVILLE RD | 2 | | 1152 GLADES RD | 2 | | 116 LILLY BUT TRAM ROAD | 2 | | 116 PLEASANT RIDGE ROAD RD | 2 | | 117 HAMBY RD | 2 | | 1177 MILLCREEK RD | 2 | | 118 HUGH JONES RD. | 2 | | 1187 DEER LODGE HWY | 2 | | 1188 DEER LODGE HWY | 2 | | 1200 LOCK DEER LODGE HWY | 2 | | 1223 DEER LODGE HWY | 2 | | 125 HENRY ASH BROOKE RD. | 2 |
|
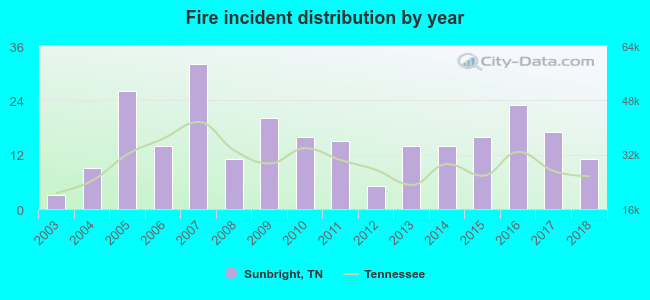 Based on the data from the years 2003 - 2018 the average number of fires per year is 15. The highest number of fires - 32 took place in 2007, and the least - 3 in 2003. The data has an increasing trend.
 30.5% incidents where reported in the morning and 69.5% in the evening. The most fires (17.9%) took place on Friday, and the least (10.6%) on Sunday.
 According to the 246 reports from years 2003 - 2018 most fires (23.6%) took place during March, and the least (2.0%) in September.
 Out of all 514 cases reported during the years 2003 - 2018, the most belonged to the categories: Fire (47.9%), Rescue & EMS (39.5%), and Good Intent Call (5.6%).
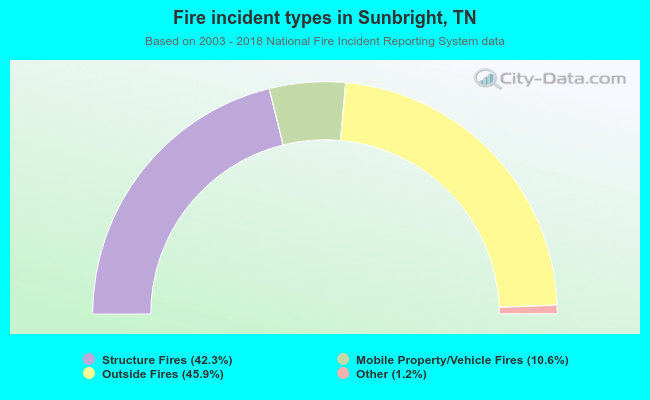 When looking into fire subcategories, the most incidents belonged to: Outside Fires (45.9%), and Structure Fires (42.3%).