Sunderland: Fire Incidents, Massachusetts (MA)
Where are fire incidents reported in Sunderland, MA
Something went wrong! Please refresh the page.
|
| |||||||||||||||||||||||||||||||||||||||||||||||||||||||||||||||||||||||||||||||||||||||||||||||||||||||||||||
2002 - 2018 National Fire Incident Reporting System (NFIRS) incidents
- Incident types reported to NFIRS in Sunderland, MA
- 31931.0%Fire
- 22321.7%Hazardous Condition
- 19919.3%Rescue & EMS
- 16015.5%False Alarm
- 686.6%Good Intent Call
- 535.2%Service Call
- 50.5%Overpressure Rupture
- 20.2%Severe Weather
- Fire incident types reported to NFIRS in Sunderland, MA
- 19059.6%Structure Fires
- 9028.2%Outside Fires
- 226.9%Mobile Property/Vehicle Fires
- 175.3%Other
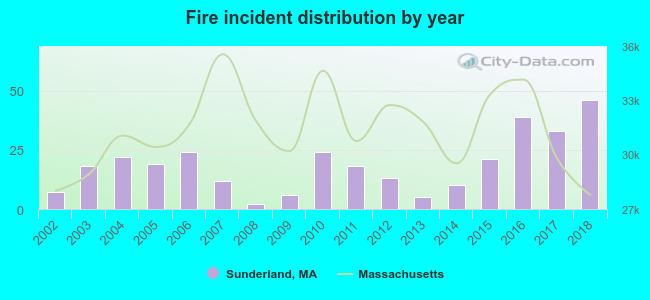 According to the data from the years 2002 - 2018 the average number of fires per year is 19. The highest number of reported fire incidents - 46 took place in 2018, and the least - 2 in 2008. The data has a rising trend.
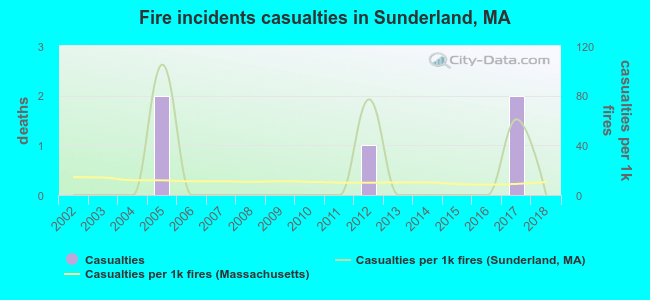 According to the data from the years 2002 - 2018 the average number of fire-related casualties per year is 0. The highest number of casualties - 2 took place in 2005, and the lowest - 0 in 2002. The data has a constant trend.
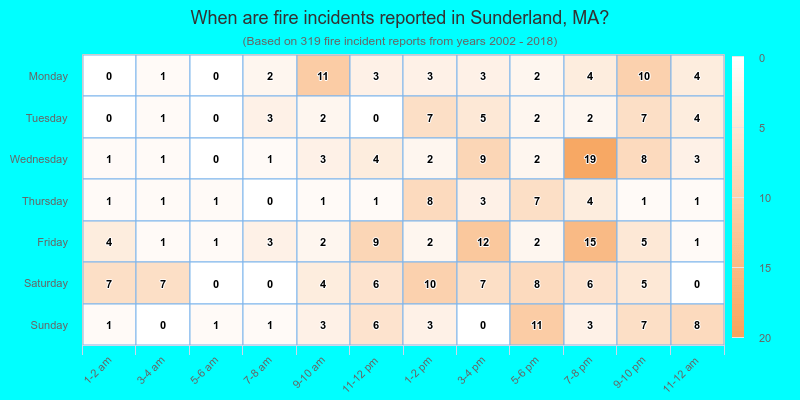
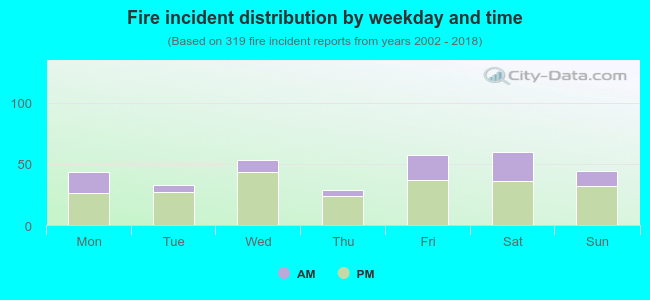 29.5% incidents where reported in the morning and 70.5% in the evening. The most fires (18.8%) took place on Saturday, and the least (9.1%) on Thursday.
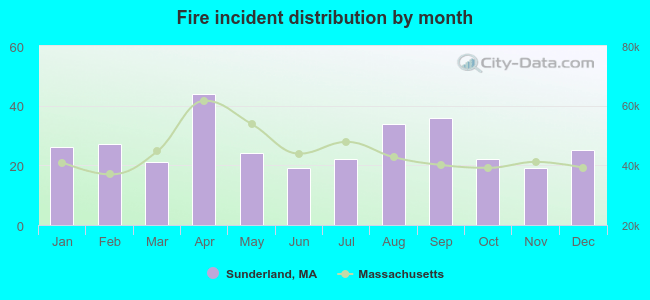 According to the 319 incident reports from years 2002 - 2018 most fires (13.8%) took place during April, and the least (6.0%) in June.
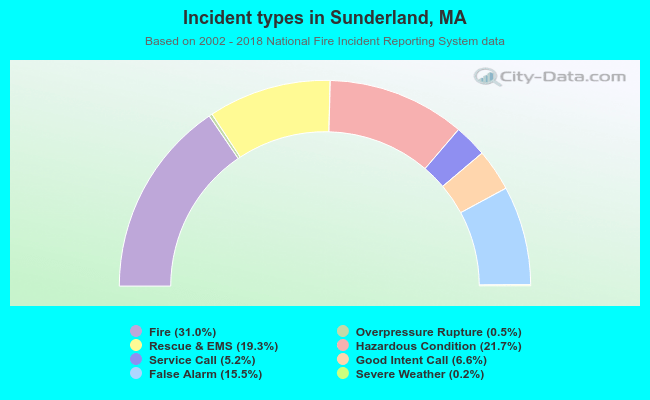 Out of all 1,029 cases reported during the years 2002 - 2018, the most belonged to the categories: Fire (31.0%), Hazardous Condition (21.7%), and Rescue & EMS (19.3%).
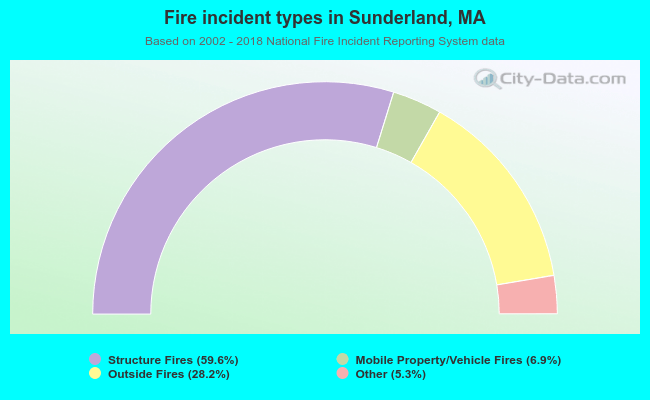 When looking into fire subcategories, the most incidents belonged to: Structure Fires (59.6%), and Outside Fires (28.2%).