Superior: Fire Incidents, Colorado (CO)
Where are fire incidents reported in Superior, CO
Something went wrong! Please refresh the page.
|
| |||||||||||||||||||||||||||||||||||||||||||||||||||||||||||||||||||||||||||||||||||||||||||||||||||||||||||||
2003 - 2018 National Fire Incident Reporting System (NFIRS) incidents
- Incident types reported to NFIRS in Superior, CO
- 1,46156.0%Rescue & EMS
- 32512.5%Good Intent Call
- 30811.8%False Alarm
- 2228.5%Hazardous Condition
- 1475.6%Fire
- 1395.3%Service Call
- 50.2%Overpressure Rupture
- Fire incident types reported to NFIRS in Superior, CO
- 6846.3%Structure Fires
- 4933.3%Outside Fires
- 1912.9%Mobile Property/Vehicle Fires
- 117.5%Other
 According to the data from the years 2003 - 2018 the average number of fire incidents per year is 9. The highest number of reported fires - 21 took place in 2018, and the least - 0 in 2015. The data has a growing trend.
The average number of yearly fire incidents per 10k residents in Superior, CO compared to nearest cities:
(Note: Based on data for the last 3 years, including only cities with population 5,000 and above)
| Superior: | 9.3 |
| Louisville: | 17.1 |
| Broomfield: | 16.5 |
| Lafayette: | 23.8 |
| Westminster: | 19.6 |
| Boulder: | 32.8 |
| Arvada: | 14.3 |
| Gunbarrel: | 7.6 |
| Erie: | 26.0 |
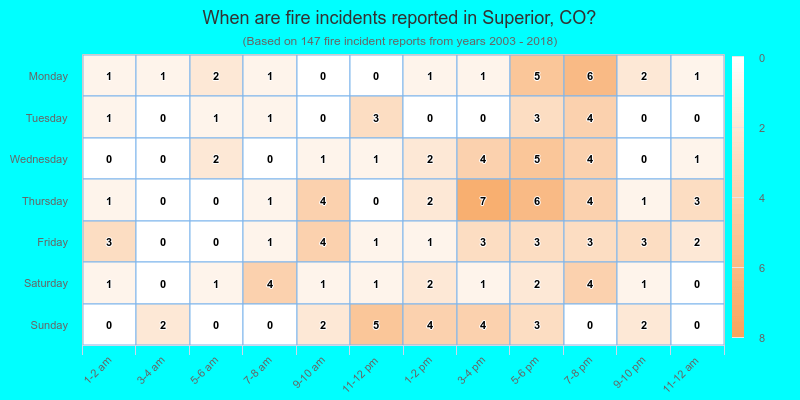
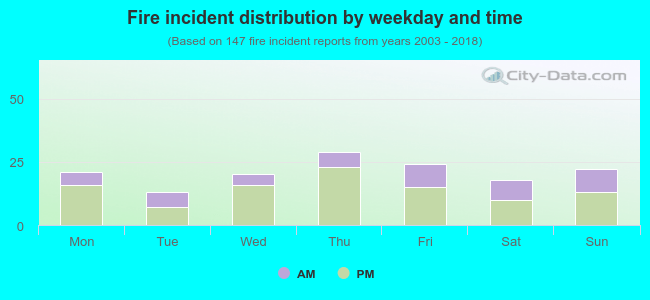 32.0% incidents where reported in the morning and 68.0% in the evening. The most fires (19.7%) took place on Thursday, and the least (8.8%) on Tuesday.
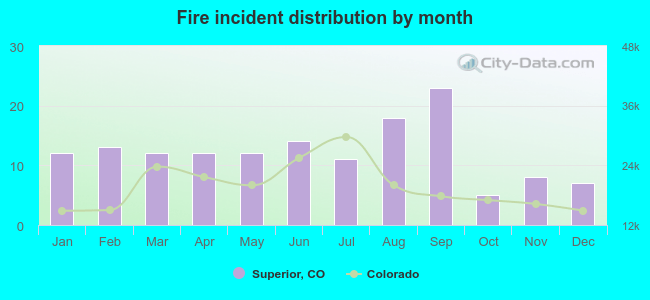 Based on the 147 reports from years 2003 - 2018 most fires (15.6%) took place during September, and the least (3.4%) in October.
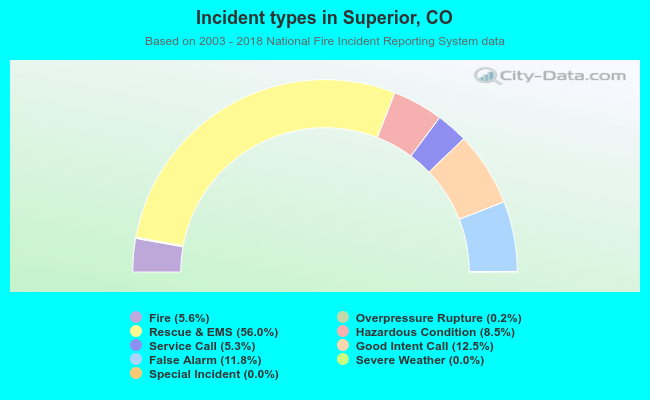 Out of all 2,609 cases reported during the years 2003 - 2018, the most belonged to the categories: Rescue & EMS (56.0%), Good Intent Call (12.5%), and False Alarm (11.8%).
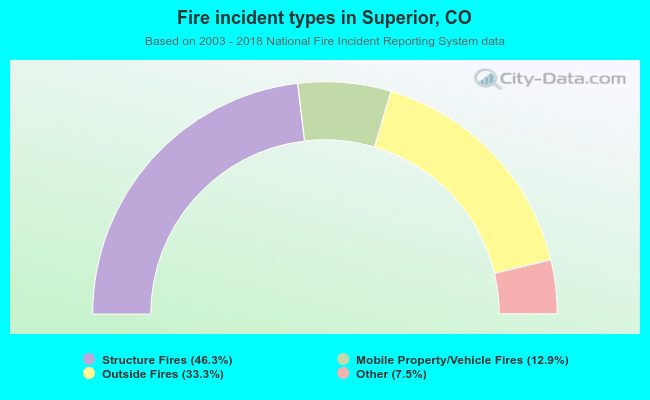 When looking into fire subcategories, the most incidents belonged to: Structure Fires (46.3%), and Outside Fires (33.3%).