Talent: Fire Incidents, Oregon (OR)
Where are fire incidents reported in Talent, OR
Something went wrong! Please refresh the page.
|
| |||||||||||||||||||||||||||||||||||||||||||||||||||||||||||||||||||||||||||||||||||||||||||||||||||||||||||||
2002 - 2018 National Fire Incident Reporting System (NFIRS) incidents
- Incident types reported to NFIRS in Talent, OR
- 2,55161.5%Rescue & EMS
- 71217.2%Good Intent Call
- 3899.4%Service Call
- 3017.3%Fire
- 932.2%False Alarm
- 912.2%Hazardous Condition
- 100.2%Special Incident
- Fire incident types reported to NFIRS in Talent, OR
- 15852.5%Structure Fires
- 9732.2%Outside Fires
- 3511.6%Mobile Property/Vehicle Fires
- 113.7%Other
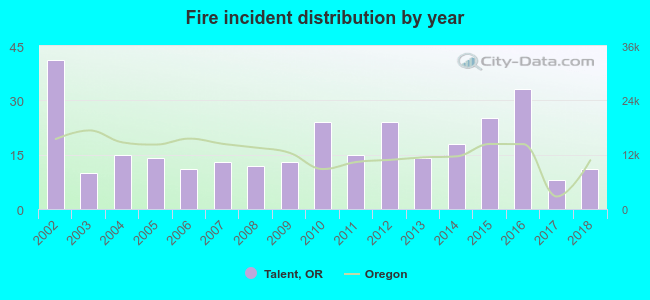 According to the data from the years 2002 - 2018 the average number of fire incidents per year is 18. The highest number of fire incidents - 41 took place in 2002, and the least - 8 in 2017. The data has a dropping trend.
The average number of yearly fire incidents per 10k residents in Talent, OR compared to nearest cities:
(Note: Based on data for the last 3 years, including only cities with population 5,000 and above)
| Talent: | 27.4 |
| Ashland: | 26.6 |
| Medford: | 17.4 |
| Central Point: | 29.9 |
| White City: | 25.9 |
| Eagle Point: | 24.4 |
| Grants Pass: | 44.5 |
| Klamath Falls: | 23.4 |
| Tenmile: | 2.1 |

 35.2% incidents where reported in the morning and 64.8% in the evening. The most fires (16.6%) took place on Wednesday, and the least (13.0%) on Thursday.
 Based on the 301 fire incident reports from years 2002 - 2018 most fires (15.0%) took place during March, and the least (4.3%) in November.
 Out of all 4,149 cases reported during the years 2002 - 2018, the most belonged to the categories: Rescue & EMS (61.5%), Good Intent Call (17.2%), and Service Call (9.4%).
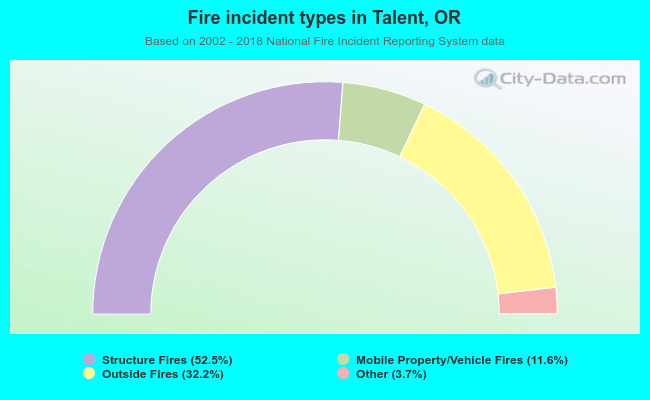 When looking into fire subcategories, the most reports belonged to: Structure Fires (52.5%), and Outside Fires (32.2%).