Tamaqua: Fire Incidents, Pennsylvania (PA)
Where are fire incidents reported in Tamaqua, PA
Something went wrong! Please refresh the page.
|
| |||||||||||||||||||||||||||||||||||||||||||||||||||||||||||||||||||||||||||||||||||||||||||||||||||||||||||||
2003 - 2018 National Fire Incident Reporting System (NFIRS) incidents
- Incident types reported to NFIRS in Tamaqua, PA
- 47223.8%Fire
- 45022.6%Rescue & EMS
- 29314.7%Hazardous Condition
- 29114.6%Good Intent Call
- 1949.8%False Alarm
- 1386.9%Special Incident
- 1336.7%Service Call
- 160.8%Severe Weather
- Fire incident types reported to NFIRS in Tamaqua, PA
- 35174.4%Structure Fires
- 4910.4%Outside Fires
- 459.5%Other
- 275.7%Mobile Property/Vehicle Fires
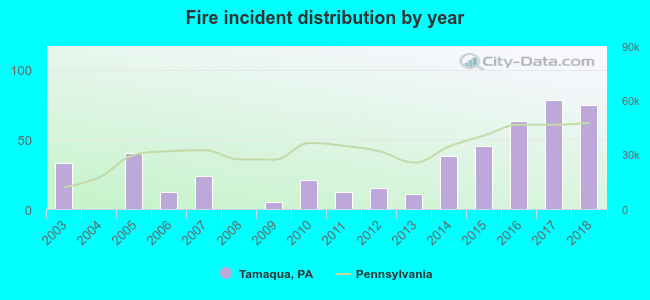 According to the data from the years 2003 - 2018 the average number of fire incidents per year is 30. The highest number of reported fires - 78 took place in 2017, and the least - 0 in 2004. The data has a rising trend.
The average number of yearly fire incidents per 10k residents in Tamaqua, PA compared to nearest cities:
(Note: Based on data for the last 3 years, including only cities with population 5,000 and above)
| Tamaqua: | 104.4 |
| Hazleton: | 50.4 |
| Lehighton: | 54.1 |
| Pottsville: | 220.0 |
| Schuylkill Haven: | 99.7 |
| Palmerton: | 61.7 |
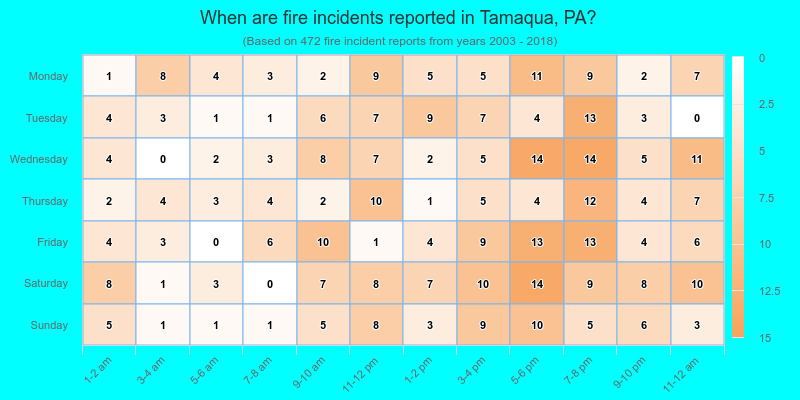
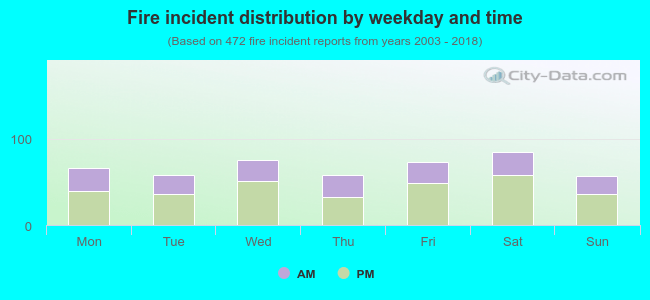 36.0% incidents where reported in the morning and 64.0% in the evening. The most fires (18.0%) took place on Saturday, and the least (12.1%) on Sunday.
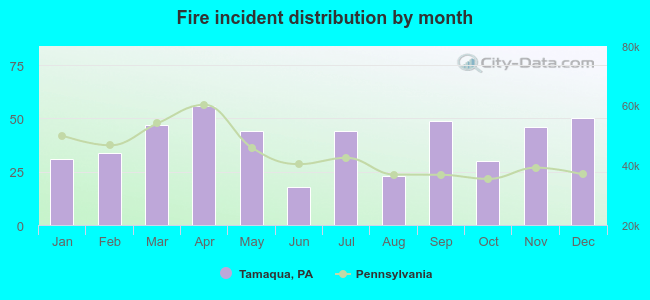 According to the 472 fire incidents from years 2003 - 2018 most fires (11.9%) took place during April, and the least (3.8%) in June.
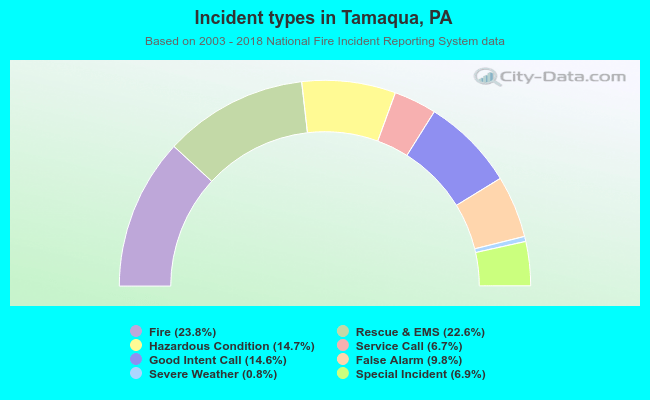 Out of all 1,987 cases reported during the years 2003 - 2018, the most belonged to the categories: Fire (23.8%), Overpressure Rupture (22.6%), and Rescue & EMS (14.7%).
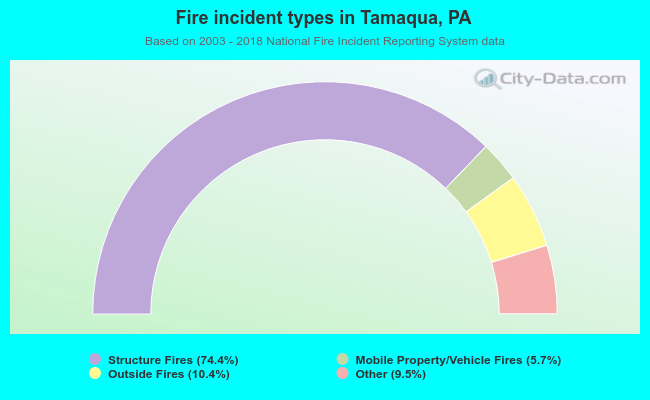 When looking into fire subcategories, the most reports belonged to: Structure Fires (74.4%), and Outside Fires (10.4%).