Taylors: Fire Incidents, South Carolina (SC)
Where are fire incidents reported in Taylors, SC
Something went wrong! Please refresh the page.
| Fire incidents reported | |
|---|---|
| Sreet name | Count |
| WADE HAMPTON BLVD | 288 |
| OLD SPARTANBURG RD | 74 |
| BRUSHY CREEK RD | 64 |
| BOLING RD | 60 |
| RUTHERFORD RD | 58 |
| LEE RD | 52 |
| LOCUST HILL RD | 52 |
| PINECROFT DR | 52 |
| REID SCHOOL RD | 46 |
| STALLINGS RD | 38 |
| CAMP CREEK RD | 30 |
| EDWARDS RD | 30 |
| DARBY RD | 26 |
| MAIN ST | 26 |
| TANNER RD | 24 |
| WAREHOUSE CT | 24 |
| WATSON RD | 24 |
| ALEXANDER RD | 22 |
| MOUNTAIN VIEW RD | 22 |
| ROBERTS RD | 22 |
| KENSINGTON RD | 20 |
| BOLING CT | 18 |
| GROCE MEADOW RD | 18 |
| OLD RUTHERFORD RD | 18 |
| PINE DR | 18 |
| SAINT MARK RD | 18 |
| TAYLORS RD | 18 |
| BARTON RD | 16 |
| BULLS RD | 16 |
| GUM SPRINGS RD | 16 |
| Other | 298 |
2002 - 2018 National Fire Incident Reporting System (NFIRS) incidents
- Incident types reported to NFIRS in Taylors, SC
- 8,19951.9%Rescue & EMS
- 2,36815.0%Service Call
- 1,5089.5%Fire
- 1,2808.1%Hazardous Condition
- 1,1797.5%Good Intent Call
- 1,1687.4%False Alarm
- 450.3%Severe Weather
- 420.3%Special Incident
- Fire incident types reported to NFIRS in Taylors, SC
- 64142.5%Outside Fires
- 58438.7%Structure Fires
- 22014.6%Mobile Property/Vehicle Fires
- 634.2%Other
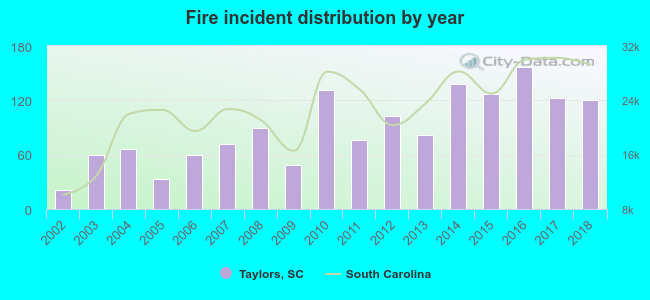 According to the data from the years 2002 - 2018 the average number of fires per year is 89. The highest number of reported fire incidents - 157 took place in 2016, and the least - 21 in 2002. The data has a rising trend.
The average number of yearly fire incidents per 10k residents in Taylors, SC compared to nearest cities:
(Note: Based on data for the last 3 years, including only cities with population 5,000 and above)
| Taylors: | 61.7 |
| Greer: | 107.6 |
| Greenville: | 183.0 |
| Berea: | 0.7 |
| Mauldin: | 30.6 |
| Gantt: | 0.7 |
| Highland: | 1.7 |
| Simpsonville: | 61.9 |
| Powderville: | 49.0 |
 The median response time based on all reported fire incidents is 5 minutes. This is lower than the state median value.
The median response time in Taylors, SC compared to nearest cities:
(Note: Based on data for all years, including only cities with at least 500 fire incidents)
| Taylors: | 5 minutes |
| Greer: | 5 minutes |
| Greenville: | 4 minutes |
| Travelers Rest: | 7 minutes |
| Mauldin: | 3 minutes |
| Duncan: | 6 minutes |
| Lyman: | 5 minutes |
| Wellford: | 7 minutes |
| Simpsonville: | 4 minutes |
 Based on the data from the years 2002 - 2018 the average number of fire-related fatalities per year is 0. The highest number of deaths - 1 took place in 2002, and the lowest - 0 in 2003. The data has a constant trend.
 Based on the reports from the years 2002 - 2018 the average number of fire-related casualties per year is 1. The highest number of injuries - 3 took place in 2017, and the lowest - 0 in 2002. The data has a constant trend.
The average number of casualties per 1,000 fires is 5. This indicator was the highest - 33 in 2003, and the lowest 0 in 2002. The trend for casualties per 1,000 fire incidents is constant. Compared to the state value the number of injuries per 1,000 fires is lower.
Based on the reports from the years 2002 - 2018 the average number of fire-related casualties per year is 1. The highest number of injuries - 3 took place in 2017, and the lowest - 0 in 2002. The data has a constant trend.
The average number of casualties per 1,000 fires is 5. This indicator was the highest - 33 in 2003, and the lowest 0 in 2002. The trend for casualties per 1,000 fire incidents is constant. Compared to the state value the number of injuries per 1,000 fires is lower.Casualties per 1,000 incidents in Taylors, SC compared to nearest cities:
(Note: Based on data for all years, including only cities with at least 500 fire incidents)
| Taylors: | 6.0 |
| Greer: | 5.2 |
| Greenville: | 7.3 |
| Travelers Rest: | 1.5 |
| Mauldin: | 6.2 |
| Duncan: | 4.2 |
| Lyman: | 0.0 |
| Wellford: | 0.0 |
| Simpsonville: | 5.3 |
 30.0% incidents where reported in the morning and 70.0% in the evening. The most fires (14.9%) took place on Thursday, and the least (13.5%) on Tuesday.
 According to the 1,508 incident reports from years 2002 - 2018 most fires (10.3%) took place during January, and the least (6.2%) in October.
 Out of all 15,800 cases reported during the years 2002 - 2018, the most belonged to the categories: Rescue & EMS (51.9%), Service Call (15.0%), and Fire (9.5%).
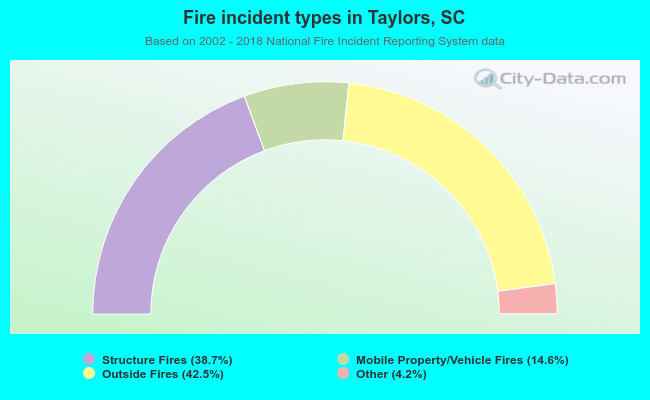 When looking into fire subcategories, the most incidents belonged to: Outside Fires (42.5%), and Structure Fires (38.7%).