Taylorsville: Fire Incidents, North Carolina (NC)
Where are fire incidents reported in Taylorsville, NC
Something went wrong! Please refresh the page.
|
| |||||||||||||||||||||||||||||||||||||||||||||||||||||||||||||||||||||||||||||||||||||||||||||||||||||||||||||
| Other | 774 | |||||||||||||||||||||||||||||||||||||||||||||||||||||||||||||||||||||||||||||||||||||||||||||||||||||||||||||
2004 - 2018 National Fire Incident Reporting System (NFIRS) incidents
- Incident types reported to NFIRS in Taylorsville, NC
- 2,51041.4%Rescue & EMS
- 1,27021.0%Fire
- 81613.5%Hazardous Condition
- 5719.4%False Alarm
- 4146.8%Service Call
- 3946.5%Good Intent Call
- 450.7%Special Incident
- 380.6%Severe Weather
- Fire incident types reported to NFIRS in Taylorsville, NC
- 66052.0%Structure Fires
- 41632.8%Outside Fires
- 1219.5%Mobile Property/Vehicle Fires
- 735.7%Other
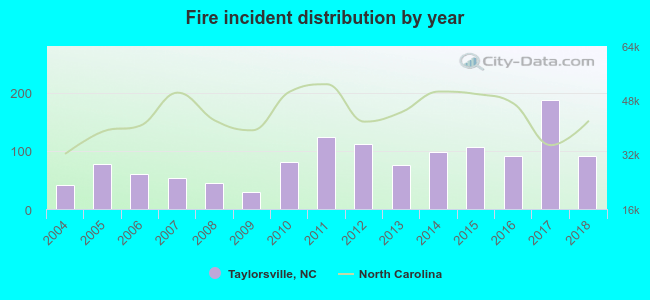 According to the data from the years 2004 - 2018 the average number of fires per year is 85. The highest number of reported fires - 187 took place in 2017, and the least - 29 in 2009. The data has a growing trend.
 The median response time based on all reported fire incidents is 6 minutes. This is comparable to the North Carolina median value.
The median response time in Taylorsville, NC compared to nearest cities:
(Note: Based on data for all years, including only cities with at least 500 fire incidents)
| Taylorsville: | 6 minutes |
| Claremont: | 5 minutes |
| Conover: | 5 minutes |
| Hickory: | 5 minutes |
| Catawba: | 6 minutes |
| Wilkesboro: | 8 minutes |
| Granite Falls: | 4 minutes |
| North Wilkesboro: | 6 minutes |
| Newton: | 5 minutes |
 32.8% incidents where reported in the morning and 67.2% in the evening. The most fires (20.2%) took place on Saturday, and the least (11.9%) on Sunday.
 According to the 1,270 fire incidents from years 2004 - 2018 most fires (14.9%) took place during February, and the least (4.6%) in June.
 Out of all 6,062 cases reported during the years 2004 - 2018, the most belonged to the categories: Rescue & EMS (41.4%), Fire (21.0%), and Hazardous Condition (13.5%).
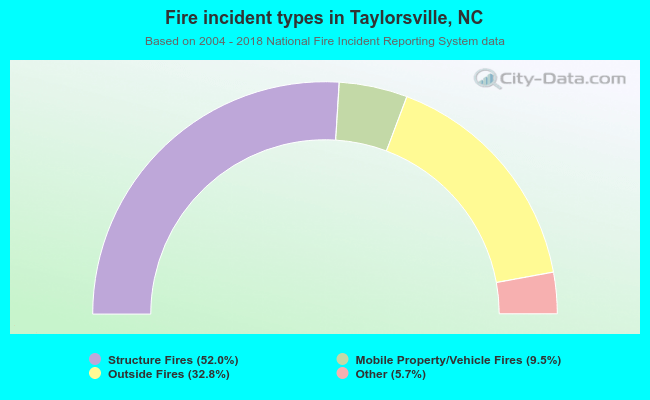 When looking into fire subcategories, the most reports belonged to: Structure Fires (52.0%), and Outside Fires (32.8%).