Temple City: Fire Incidents, California (CA)
Where are fire incidents reported in Temple City, CA
Something went wrong! Please refresh the page.
|
| |||||||||||||||||||||||||||||||||||||||||||||||||||||||||||||||||||||||||||||||||||||||||||||||||||||||||||||
2005 - 2018 National Fire Incident Reporting System (NFIRS) incidents
- Incident types reported to NFIRS in Temple City, CA
- 6,84073.5%Rescue & EMS
- 1,19612.8%Good Intent Call
- 3393.6%False Alarm
- 3183.4%Hazardous Condition
- 3063.3%Fire
- 2883.1%Service Call
- 140.2%Special Incident
- Fire incident types reported to NFIRS in Temple City, CA
- 13443.8%Structure Fires
- 11236.6%Outside Fires
- 3712.1%Mobile Property/Vehicle Fires
- 237.5%Other
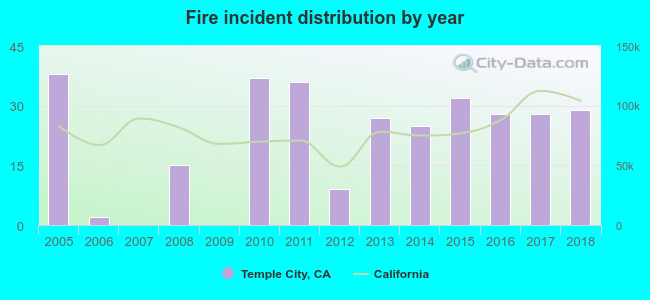 According to the data from the years 2005 - 2018 the average number of fire incidents per year is 22. The highest number of fire incidents - 38 took place in 2005, and the least - 0 in 2007. The data has a dropping trend.
The average number of yearly fire incidents per 10k residents in Temple City, CA compared to nearest cities:
(Note: Based on data for the last 3 years, including only cities with population 5,000 and above)
| Temple City: | 7.8 |
| East San Gabriel: | 1.7 |
| San Gabriel: | 15.8 |
| Arcadia: | 12.9 |
| Rosemead: | 13.7 |
| El Monte: | 14.1 |
| San Marino: | 11.7 |
| South El Monte: | 26.1 |
| South San Gabriel: | 12.4 |

 35.6% incidents where reported in the morning and 64.4% in the evening. The most fires (14.7%) took place on Monday, and the least (13.4%) on Tuesday.
 Based on the 306 incident reports from years 2005 - 2018 most fires (13.7%) took place during July, and the least (4.9%) in October.
 Out of all 9,308 cases reported during the years 2005 - 2018, the most belonged to the categories: Rescue & EMS (73.5%), Good Intent Call (12.8%), and False Alarm (3.6%).
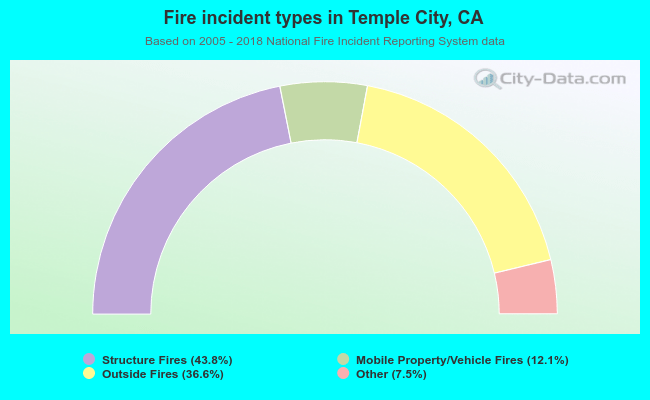 When looking into fire subcategories, the most reports belonged to: Structure Fires (43.8%), and Outside Fires (36.6%).