Tiffin: Fire Incidents, Ohio (OH)
Where are fire incidents reported in Tiffin, OH
Something went wrong! Please refresh the page.
| Fire incidents reported | |
|---|---|
| Sreet name | Count |
| MARKET ST | 118 |
| SANDUSKY ST | 68 |
| WASHINGTON ST | 64 |
| MONROE ST | 40 |
| MIAMI ST | 38 |
| US 224 | 32 |
| 2ND AVE | 30 |
| OH SR 53 HWY | 30 |
| ST. RT. 18 RT | 30 |
| PERRY ST | 28 |
| ST RT 101 HWY | 28 |
| SYCAMORE ST | 28 |
| WATER ST | 28 |
| CO. RD. 50 RD | 22 |
| HALL ST | 20 |
| JACKSON ST | 20 |
| ST. RT. 53 | 20 |
| CO RD 15 RDS | 18 |
| TOWNSHIP RD 131 RD | 18 |
| MELMORE ST | 16 |
| 30 | 14 |
| ADAMS ST | 14 |
| CR 6 RD | 14 |
| FROST PKY | 14 |
| MARKET (451 - 565) ST | 14 |
| SR 53 | 14 |
| ST RT 231 HWY | 14 |
| TWP RD 122 CENTER RD | 14 |
| TWP RD. 118 TYBER RD | 14 |
| 31 CR | 12 |
| Other | 684 |
2002 - 2018 National Fire Incident Reporting System (NFIRS) incidents
- Incident types reported to NFIRS in Tiffin, OH
- 8,55164.3%Rescue & EMS
- 1,51811.4%Fire
- 1,1098.3%Hazardous Condition
- 1,0958.2%False Alarm
- 5053.8%Service Call
- 4463.4%Good Intent Call
- 280.2%Severe Weather
- 210.2%Special Incident
- 200.2%Overpressure Rupture
- Fire incident types reported to NFIRS in Tiffin, OH
- 70846.6%Structure Fires
- 60439.8%Outside Fires
- 19012.5%Mobile Property/Vehicle Fires
- 161.1%Other
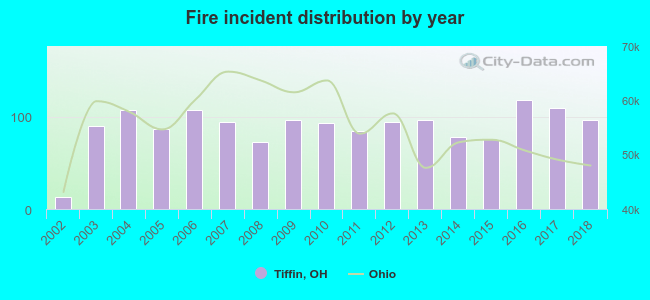 Based on the data from the years 2002 - 2018 the average number of fire incidents per year is 89. The highest number of reported fire incidents - 118 took place in 2016, and the least - 13 in 2002. The data has a growing trend.
The average number of yearly fire incidents per 10k residents in Tiffin, OH compared to nearest cities:
(Note: Based on data for the last 3 years, including only cities with population 5,000 and above)
| Tiffin: | 61.1 |
| Fostoria: | 62.5 |
| Fremont: | 66.5 |
| Clyde: | 56.5 |
| Upper Sandusky: | 82.3 |
| Bellevue: | 67.8 |
| Willard: | 78.2 |
| Bucyrus: | 55.4 |
| Findlay: | 28.9 |
 The median response time based on all reported fire incidents is 4 minutes. This is lower compared to the state median value.
The median response time in Tiffin, OH compared to nearest cities:
(Note: Based on data for all years, including only cities with at least 500 fire incidents)
| Tiffin: | 4 minutes |
| Fostoria: | 4 minutes |
| Fremont: | 4 minutes |
| Clyde: | 6 minutes |
| Upper Sandusky: | 7 minutes |
| Bellevue: | 6 minutes |
| Willard: | 7 minutes |
| Bucyrus: | 5 minutes |
| Findlay: | 6 minutes |
 Based on the reports from the years 2002 - 2018 the average number of fire-related casualties per year is 0. The highest number of reported injuries - 2 took place in 2004, and the lowest - 0 in 2002. The data has a constant trend.
The average number of casualties per 1,000 fire incidents is 4. This indicator was the highest - 21 in 2009, and the lowest 0 in 2002. The trend for casualties per 1,000 fires is constant. Compared to the Ohio value the number of injuries per 1,000 incidents is much lower.
Based on the reports from the years 2002 - 2018 the average number of fire-related casualties per year is 0. The highest number of reported injuries - 2 took place in 2004, and the lowest - 0 in 2002. The data has a constant trend.
The average number of casualties per 1,000 fire incidents is 4. This indicator was the highest - 21 in 2009, and the lowest 0 in 2002. The trend for casualties per 1,000 fires is constant. Compared to the Ohio value the number of injuries per 1,000 incidents is much lower.
 28.6% incidents where reported in the morning and 71.4% in the evening. The most fires (16.3%) took place on Saturday, and the least (12.4%) on Friday.
 According to the 1,518 reports from years 2002 - 2018 most fires (10.6%) took place during July, and the least (6.1%) in January.
 Out of all 13,293 cases reported during the years 2002 - 2018, the most belonged to the categories: Rescue & EMS (64.3%), Fire (11.4%), and Hazardous Condition (8.3%).
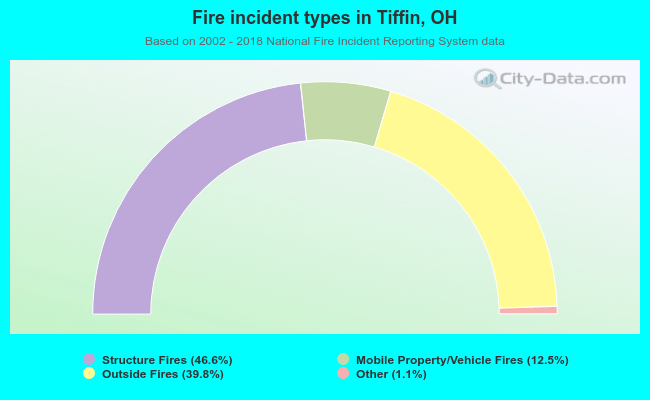 When looking into fire subcategories, the most incidents belonged to: Structure Fires (46.6%), and Outside Fires (39.8%).