Toppenish: Fire Incidents, Washington (WA)
Where are fire incidents reported in Toppenish, WA
Something went wrong! Please refresh the page.
| Fire incidents reported | |
|---|---|
| Sreet name | Count |
| FORT RD | 150 |
| 1ST AVE | 138 |
| OLDENWAY RD | 124 |
| WINAWAY RD | 120 |
| MCDONALD RD | 106 |
| MCKINLEY RD | 96 |
| BUENA WAY | 92 |
| TRACK RD | 92 |
| BRANCH RD | 86 |
| SR 97 HWY | 86 |
| TOPPENISH AVE | 86 |
| LARUE RD | 82 |
| MEYERS RD | 72 |
| US 97 HWY | 68 |
| PUMPHOUSE RD | 54 |
| G ST | 52 |
| MARION DRAIN RD | 52 |
| ELM ST | 50 |
| WASHINGTON AVE | 50 |
| FIR ST | 48 |
| PLANK RD | 46 |
| SR-97 HWY | 44 |
| SR 22 HWY | 42 |
| OLD GOLDENDALE RD | 40 |
| ROBBINS RD | 40 |
| ELMWOOD RD | 38 |
| ASHUE RD | 36 |
| BECKER RD | 34 |
| BEECH ST | 34 |
| CHESTNUT ST | 34 |
| Other | 251 |
2002 - 2018 National Fire Incident Reporting System (NFIRS) incidents
- Incident types reported to NFIRS in Toppenish, WA
- 5,95957.8%Rescue & EMS
- 2,34322.7%Fire
- 9619.3%Good Intent Call
- 3583.5%Service Call
- 3363.3%False Alarm
- 2902.8%Hazardous Condition
- 480.5%Special Incident
- Fire incident types reported to NFIRS in Toppenish, WA
- 1,24553.1%Outside Fires
- 55723.8%Structure Fires
- 41717.8%Mobile Property/Vehicle Fires
- 1245.3%Other
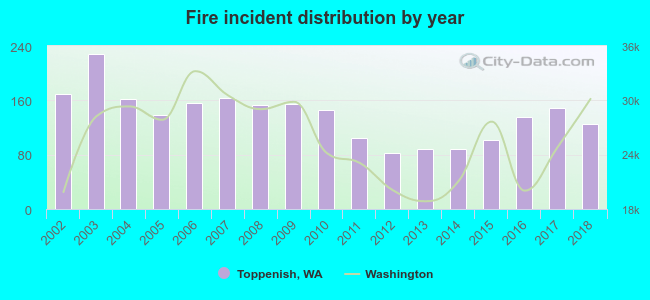 According to the data from the years 2002 - 2018 the average number of fire incidents per year is 138. The highest number of fire incidents - 228 took place in 2003, and the least - 83 in 2012. The data has a decreasing trend.
The average number of yearly fire incidents per 10k residents in Toppenish, WA compared to nearest cities:
(Note: Based on data for the last 3 years, including only cities with population 5,000 and above)
| Toppenish: | 151.9 |
| Wapato: | 264.0 |
| Sunnyside: | 59.9 |
| Union Gap: | 61.4 |
| Terrace Heights: | 1.4 |
| Yakima: | 69.6 |
| West Valley: | 1.4 |
| Grandview: | 44.6 |
| Selah: | 100.3 |
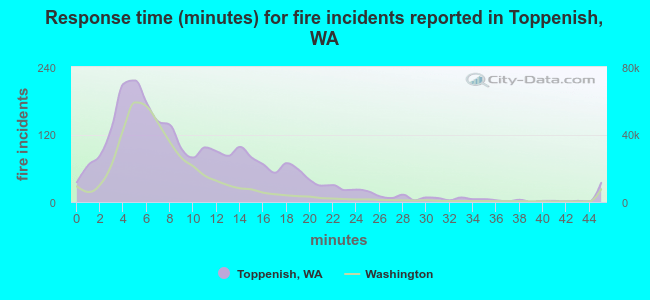 The median response time based on all reported fire incidents is 8 minutes. This is comparable to the state median value.
The median response time in Toppenish, WA compared to nearest cities:
(Note: Based on data for all years, including only cities with at least 500 fire incidents)
| Toppenish: | 8 minutes |
| Zillah: | 9 minutes |
| Granger: | 11 minutes |
| Wapato: | 10 minutes |
| Moxee: | 10 minutes |
| Sunnyside: | 8 minutes |
| Union Gap: | 7 minutes |
| Yakima: | 7 minutes |
| White Swan: | 14 minutes |
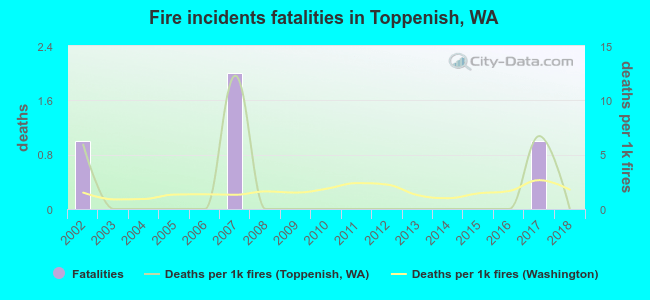 According to the reports from the years 2002 - 2018 the average number of fire-related fatalities per year is 0. The highest number of deaths - 2 took place in 2007, and the lowest - 0 in 2003. The data has a declining trend.
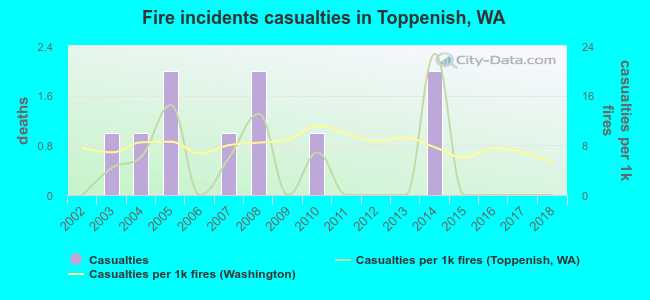 According to the reports from the years 2002 - 2018 the average number of fire-related yearly casualties is 1. The highest number of injuries - 2 took place in 2005, and the lowest - 0 in 2002. The data has a constant trend.
The average number of casualties per 1,000 fires is 4. This indicator was the highest - 23 in 2014, and the lowest 0 in 2002. The trend for injuries per 1,000 incidents is constant. Compared to the Washington value the number of injuries per 1,000 fire incidents is lower.
According to the reports from the years 2002 - 2018 the average number of fire-related yearly casualties is 1. The highest number of injuries - 2 took place in 2005, and the lowest - 0 in 2002. The data has a constant trend.
The average number of casualties per 1,000 fires is 4. This indicator was the highest - 23 in 2014, and the lowest 0 in 2002. The trend for injuries per 1,000 incidents is constant. Compared to the Washington value the number of injuries per 1,000 fire incidents is lower.
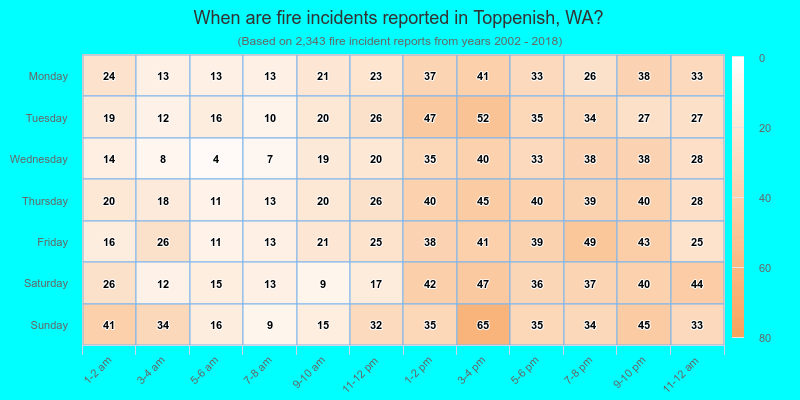
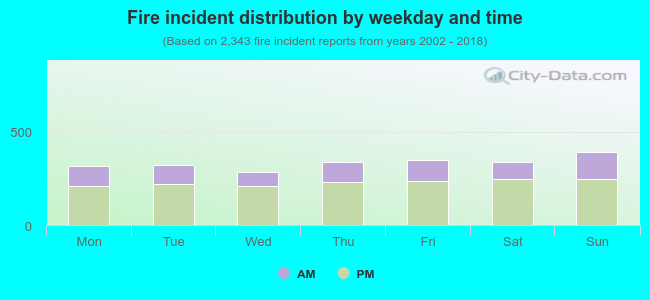 31.6% incidents where reported in the morning and 68.4% in the evening. The most fires (16.8%) took place on Sunday, and the least (12.1%) on Wednesday.
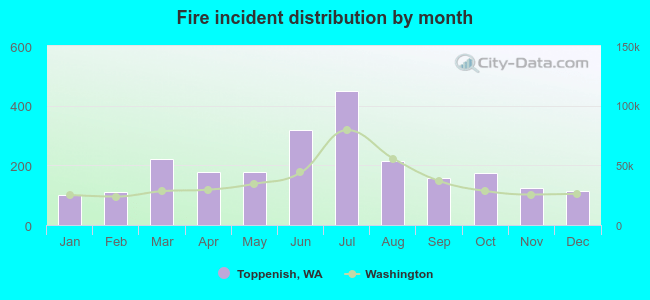 According to the 2,343 fire incidents from years 2002 - 2018 most fires (19.2%) took place during July, and the least (4.3%) in January.
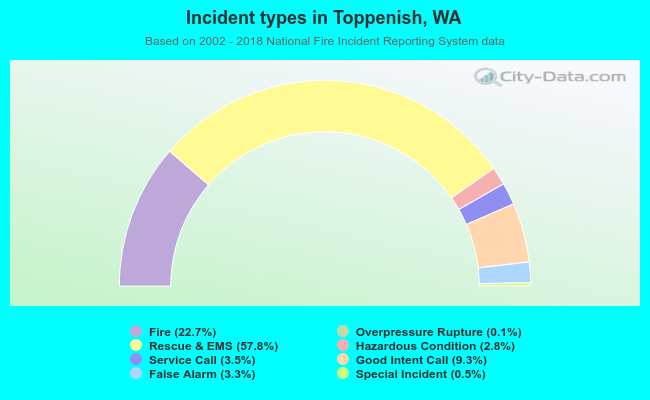 Out of all 10,302 cases reported during the years 2002 - 2018, the most belonged to the categories: Rescue & EMS (57.8%), Fire (22.7%), and Good Intent Call (9.3%).
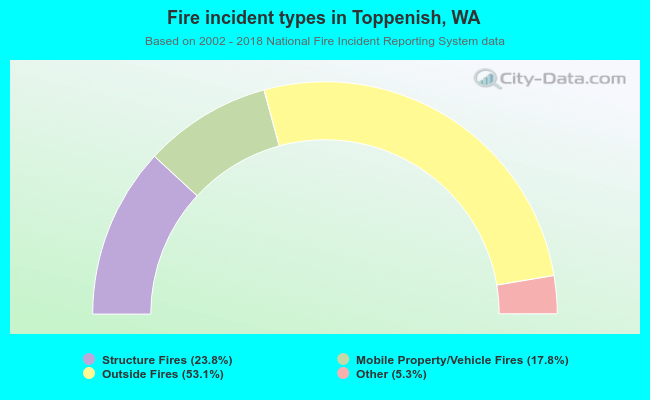 When looking into fire subcategories, the most incidents belonged to: Outside Fires (53.1%), and Structure Fires (23.8%).