Towanda: Fire Incidents, Kansas (KS)
Where are fire incidents reported in Towanda, KS
Something went wrong! Please refresh the page.
|
| |||||||||||||||||||||||||||||||||||||||||||||||||||||||||||||||||||||||||||||||||||||||||||||||||||||||||||||
2002 - 2018 National Fire Incident Reporting System (NFIRS) incidents
- Incident types reported to NFIRS in Towanda, KS
- 49537.6%Fire
- 43533.0%Rescue & EMS
- 16112.2%Good Intent Call
- 1088.2%Service Call
- 826.2%Hazardous Condition
- 282.1%False Alarm
- 40.3%Overpressure Rupture
- 30.2%Severe Weather
- Fire incident types reported to NFIRS in Towanda, KS
- 33968.5%Outside Fires
- 11022.2%Structure Fires
- 367.3%Mobile Property/Vehicle Fires
- 102.0%Other
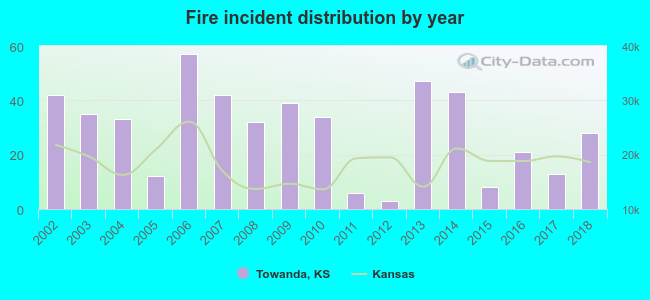 According to the data from the years 2002 - 2018 the average number of fire incidents per year is 29. The highest number of reported fire incidents - 57 took place in 2006, and the least - 3 in 2012. The data has a dropping trend.
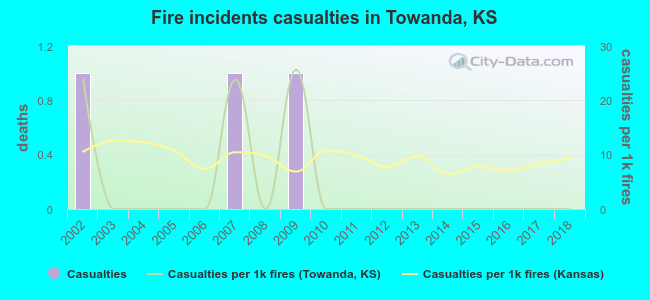 Based on the reports from the years 2002 - 2018 the average number of fire-related casualties per year is 0. The highest number of injuries - 1 took place in 2002, and the lowest - 0 in 2003. The data has a declining trend.
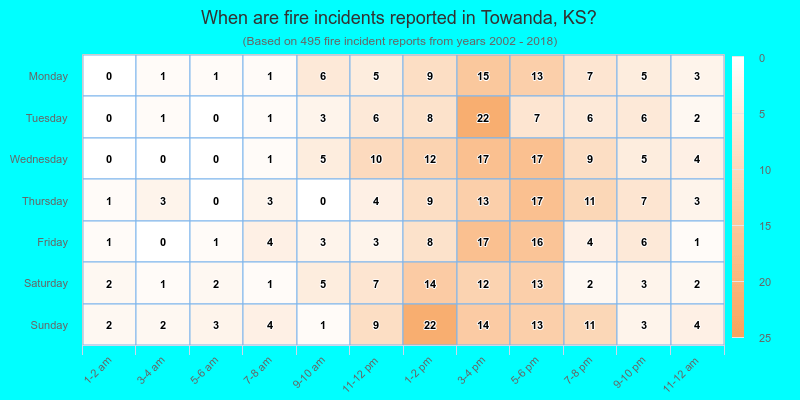
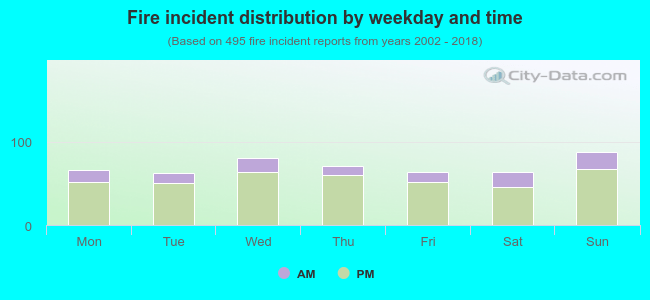 20.8% incidents where reported in the morning and 79.2% in the evening. The most fires (17.8%) took place on Sunday, and the least (12.5%) on Tuesday.
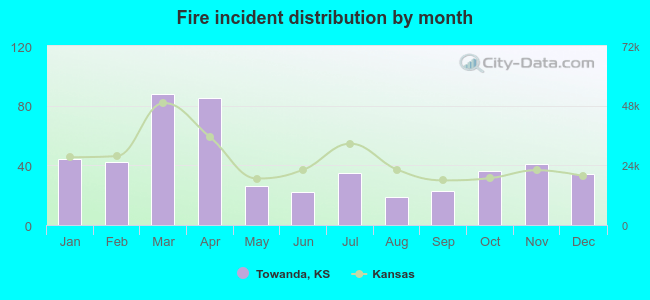 Based on the 495 fires from years 2002 - 2018 most fires (17.8%) took place during March, and the least (3.8%) in August.
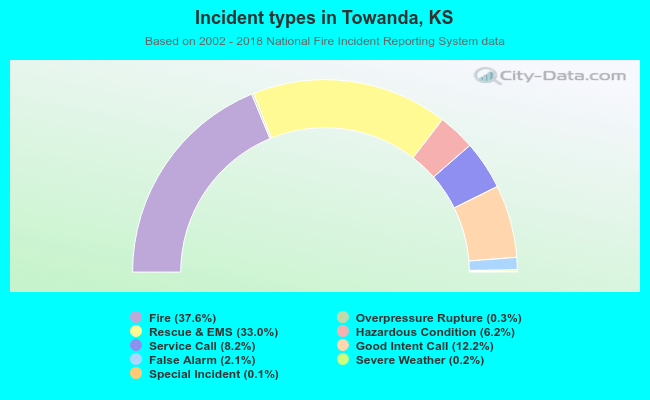 Out of all 1,317 cases reported during the years 2002 - 2018, the most belonged to the categories: Fire (37.6%), Rescue & EMS (33.0%), and Good Intent Call (12.2%).
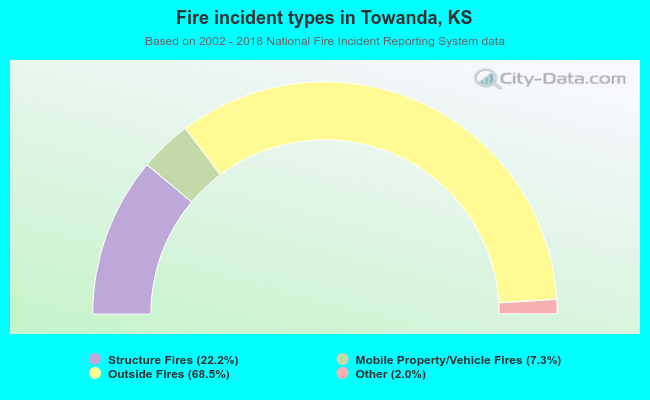 When looking into fire subcategories, the most incidents belonged to: Outside Fires (68.5%), and Structure Fires (22.2%).