| Fire incidents reported |
|---|
| Sreet name | Count |
|---|
| JACOB MCKIE RD | 16 | | EDGEFIELD RD | 12 | | EDGEFIELD RD | 8 | | MOSLEY DR | 8 | | NICHOLSON RD | 8 | | 51 HUMMINGBIRD LANE | 6 | | CARDINAL DR | 6 | | JOHNSTON HWY | 6 | | MAXWELL DR | 6 | | BETTIS ACADEMY RD | 4 | | BETTIS ACADEMY | 4 | | BETTIS ACADEMY RD | 4 | | EDGEFIELD HWY | 4 | | HWY 19 | 4 | | HWY 25 HWY | 4 | | JACOB MCKIE RD | 4 | | ROCK CREEK RD | 4 | | ROLLING HILLS DRIVE | 4 | | RUNNING RIDGE DR | 4 | | SABLE LANE | 4 | | SPRINGFIELD CHURCH RD | 4 | | TRUCKER DR | 4 | | WATERS EDGE DR | 4 | | WINDING RD | 4 | | WINDING ROAD | 4 |
| | | Fire incidents reported |
|---|
| Sreet name | Count |
|---|
| WOODWARD LAKE RD | 4 | | WOODYARD RD | 4 | | 1 SHEPPARD DRIVE | 2 | | 110 MT. CANAAN DRIVE | 2 | | 139 NICKELSON ROAD | 2 | | 145 CASALINA DR | 2 | | 178 COMMUNITY ROAD | 2 | | 2434 EDGEFIELD ROAD | 2 | | 43 HUMMINGBIRD LN | 2 | | 656 WOODYARD ROAD | 2 | | 75 LONG LEAF DRIVE | 2 | | 91 NICHOLSON RD | 2 | | ACADEMY ESTATES RD | 2 | | ACADEMY ST | 2 | | ARCHIE WARE RD | 2 | | ARROWHEAD LAKE RD | 2 | | AUGUSTA RD | 2 | | BALLARD DR | 2 | | BRIGHTHOP RD | 2 | | BUTLER ROAD | 2 | | CITRUS RD | 2 | | COMMUNITY RD | 2 | | EAST WISE STREET | 2 | | GOODWIN | 2 | | |
|
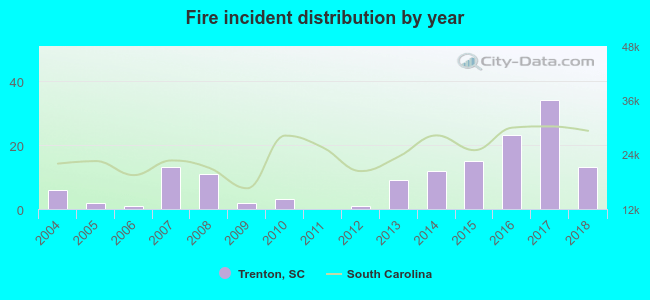 Based on the data from the years 2004 - 2018 the average number of fires per year is 10. The highest number of reported fire incidents - 34 took place in 2017, and the least - 0 in 2011. The data has a growing trend.
 22.1% incidents where reported in the morning and 77.9% in the evening. The most fires (20.0%) took place on Saturday, and the least (10.3%) on Friday.
 According to the 145 fire incidents from years 2004 - 2018 most fires (16.6%) took place during March, and the least (4.1%) in August.
 Out of all 296 cases reported during the years 2004 - 2018, the most belonged to the categories: Fire (49.0%), Overpressure Rupture (29.4%), and Good Intent Call (6.8%).
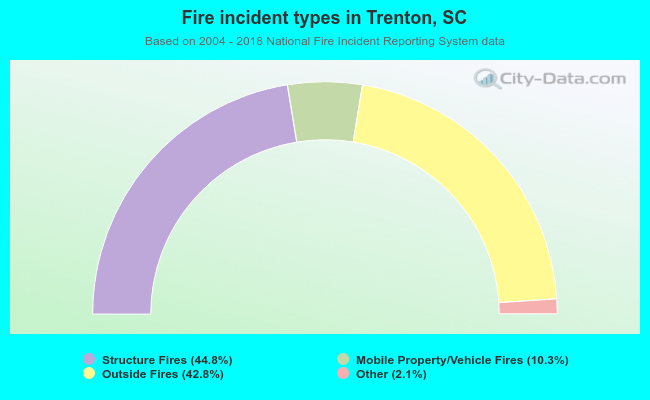 When looking into fire subcategories, the most incidents belonged to: Structure Fires (44.8%), and Outside Fires (42.8%).