Trinidad: Fire Incidents, Colorado (CO)
Where are fire incidents reported in Trinidad, CO
Something went wrong! Please refresh the page.
|
| |||||||||||||||||||||||||||||||||||||||||||||||||||||||||||||||||||||||||||||||||||||||||||||||||||||||||||||
| Other | 82 | |||||||||||||||||||||||||||||||||||||||||||||||||||||||||||||||||||||||||||||||||||||||||||||||||||||||||||||
2004 - 2018 National Fire Incident Reporting System (NFIRS) incidents
- Incident types reported to NFIRS in Trinidad, CO
- 3,81351.3%Rescue & EMS
- 1,20316.2%Hazardous Condition
- 81811.0%Fire
- 75210.1%Good Intent Call
- 4876.6%Service Call
- 3354.5%False Alarm
- 170.2%Special Incident
- 80.1%Overpressure Rupture
- Fire incident types reported to NFIRS in Trinidad, CO
- 42652.1%Outside Fires
- 20424.9%Structure Fires
- 12715.5%Mobile Property/Vehicle Fires
- 617.5%Other
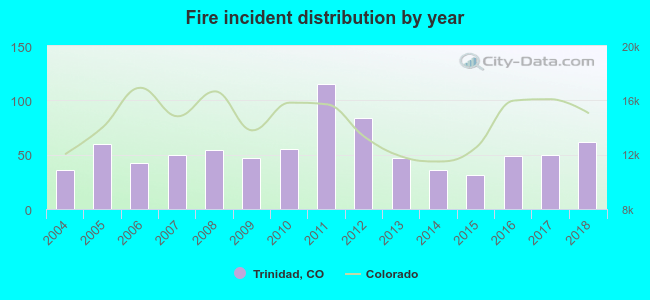 According to the data from the years 2004 - 2018 the average number of fire incidents per year is 55. The highest number of fires - 115 took place in 2011, and the least - 31 in 2015. The data has an increasing trend.
The average number of yearly fire incidents per 10k residents in Trinidad, CO compared to nearest cities:
(Note: Based on data for the last 3 years, including only cities with population 5,000 and above)
| Trinidad: | 65.5 |
| Pueblo: | 58.0 |
| La Junta: | 143.6 |
| Alamosa: | 80.4 |
| Pueblo West: | 9.0 |
 The median response time based on all reported fire incidents is 6 minutes. This is about the same as the Colorado median value.
The median response time in Trinidad, CO compared to nearest cities:
(Note: Based on data for all years, including only cities with at least 500 fire incidents)
| Trinidad: | 6 minutes |
| Rocky Ford: | 5 minutes |
| Pueblo: | 6 minutes |
| La Junta: | 8 minutes |
| Alamosa: | 6 minutes |
| Pueblo West: | 7 minutes |
 32.6% incidents where reported in the morning and 67.4% in the evening. The most fires (15.4%) took place on Saturday, and the least (13.0%) on Wednesday.
 According to the 818 incident reports from years 2004 - 2018 most fires (12.8%) took place during June, and the least (5.1%) in October.
 Out of all 7,434 cases reported during the years 2004 - 2018, the most belonged to the categories: Rescue & EMS (51.3%), Hazardous Condition (16.2%), and Fire (11.0%).
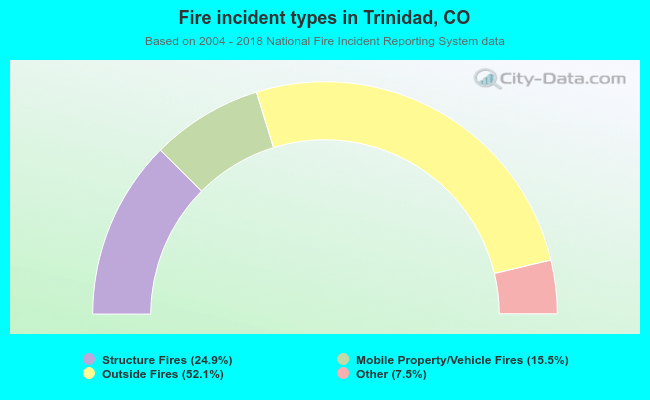 When looking into fire subcategories, the most incidents belonged to: Outside Fires (52.1%), and Structure Fires (24.9%).