Tullytown: Fire Incidents, Pennsylvania (PA)
Where are fire incidents reported in Tullytown, PA
Something went wrong! Please refresh the page.
|
| |||||||||||||||||||||||||||||||||||||||||||||||||||||||||||||||||||||||||||||||||||||||||
2003 - 2018 National Fire Incident Reporting System (NFIRS) incidents
- Incident types reported to NFIRS in Tullytown, PA
- 13250.2%Fire
- 7026.6%Hazardous Condition
- 269.9%Good Intent Call
- 155.7%False Alarm
- 134.9%Rescue & EMS
- 51.9%Service Call
- 20.8%Special Incident
- Fire incident types reported to NFIRS in Tullytown, PA
- 9269.7%Structure Fires
- 2317.4%Outside Fires
- 1410.6%Mobile Property/Vehicle Fires
- 32.3%Other
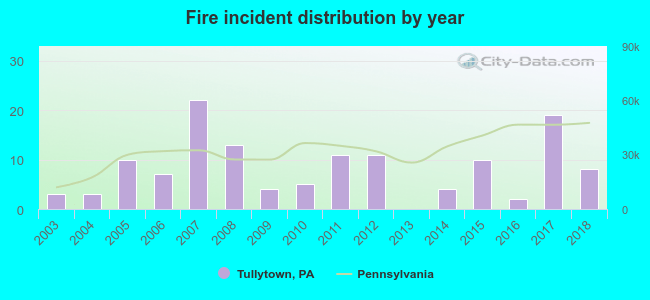 According to the data from the years 2003 - 2018 the average number of fire incidents per year is 8. The highest number of reported fire incidents - 22 took place in 2007, and the least - 0 in 2013. The data has a growing trend.
 40.2% incidents where reported in the morning and 59.8% in the evening. The most fires (23.5%) took place on Friday, and the least (7.6%) on Sunday.
 According to the 132 fire incidents from years 2003 - 2018 most fires (22.0%) took place during September, and the least (0.0%) in August.
 Out of all 263 cases reported during the years 2003 - 2018, the most belonged to the categories: Fire (50.2%), Rescue & EMS (26.6%), and Service Call (9.9%).
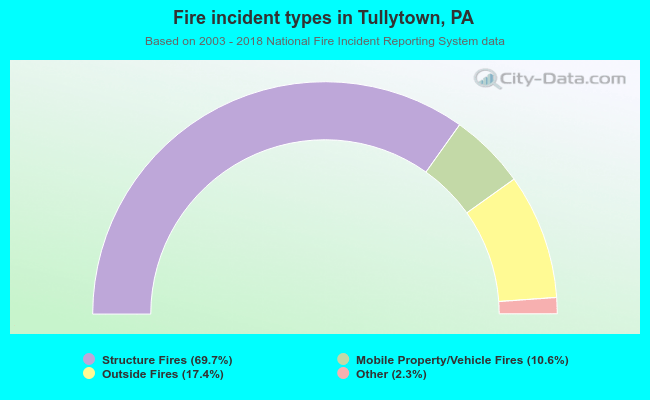 When looking into fire subcategories, the most incidents belonged to: Structure Fires (69.7%), and Outside Fires (17.4%).