| Fire incidents reported |
|---|
| Sreet name | Count |
|---|
| HWY 61 | 10 | | EUREKA ST | 6 | | HIGHWAY 61 | 6 | | HWY 42 | 6 | | HWY 77 N | 6 | | OLD RIVER ROAD | 6 | | 960 HWY 61 N | 4 | | COUNTRY VIEW RD | 4 | | I 55 23 MM | 4 | | I 55 24 MM | 4 | | INTERSTATE 55 | 4 | | SCHOOL ST | 4 | | STACEY RD | 4 | | STATE HIGHWAY 55 HWY | 4 | | 11284 ST HWY 118 | 2 | | 116 GUM STREET | 2 | | 126 CHURCH | 2 | | 127 CATALINA | 2 | | 1315 HWY 42 | 2 | | 142 WAH | 2 | | 144 GUM | 2 | | 1511 GILMORE RD | 2 | | 15543 HWY 77 | 2 | | 165 BUTLER | 2 | | 175 UPSHAW APT4 | 2 |
| | | Fire incidents reported |
|---|
| Sreet name | Count |
|---|
| 17MM I 55 | 2 | | 184 GUM | 2 | | 19 MM I 55 | 2 | | 201 EUREKA | 2 | | 218 COUNTRYVIEW RD | 2 | | 224 MACIDONIA RD | 2 | | 23 SCHOOL ST | 2 | | 231 W SCHOOL | 2 | | 26 GALBREATH | 2 | | 2717 CLARKDALE RD | 2 | | 28 CATALINA | 2 | | 28 CATILINA | 2 | | 2ND ST | 2 | | 314 EUREKA | 2 | | 323 W SCHOOL | 2 | | 332 EUREKA | 2 | | 334COUNTRYVIEW RD | 2 | | 400 BOONE | 2 | | 42 NORTH FOURTH | 2 | | 46 WAH | 2 | | 460 EUREKA | 2 | | 48 SCHOOL ST | 2 | | 518 HAMMOND RD | 2 | | 61 GUM STREET | 2 | | 616 PORTLAND | 2 |
|
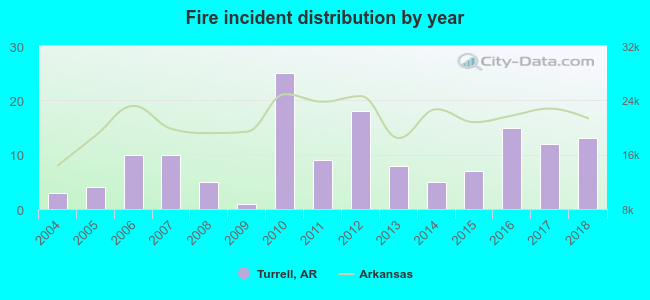 According to the data from the years 2004 - 2018 the average number of fire incidents per year is 10. The highest number of fire incidents - 25 took place in 2010, and the least - 1 in 2009. The data has a growing trend.
 35.9% incidents where reported in the morning and 64.1% in the evening. The most fires (17.2%) took place on Sunday, and the least (11.0%) on Monday.
 Based on the 145 fires from years 2004 - 2018 most fires (16.6%) took place during September, and the least (3.4%) in July.
 Out of all 186 cases reported during the years 2004 - 2018, the most belonged to the categories: Fire (78.0%), Rescue & EMS (9.1%), and Overpressure Rupture (7.0%).
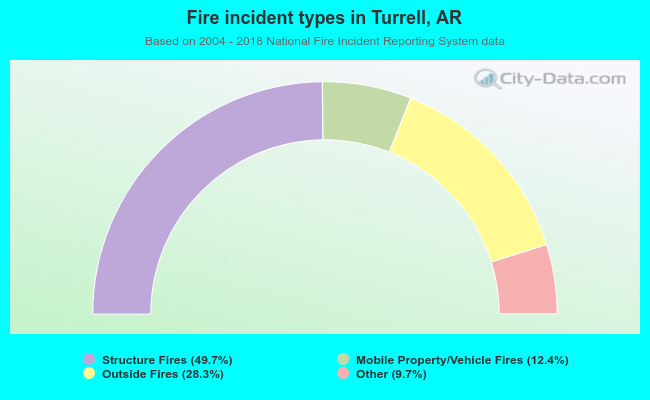 When looking into fire subcategories, the most reports belonged to: Structure Fires (49.7%), and Outside Fires (28.3%).