| Fire incidents reported |
|---|
| Sreet name | Count |
|---|
| LEPPEK RD | 12 | | VERONA RD | 8 | | ATWATER RD | 6 | | MORRISON RD | 6 | | WASHINGTON ST | 6 | | 3652 LEPPEK RD | 4 | | CUMBER RD | 4 | | GERMANIA RD | 4 | | HOLBROCK | 4 | | HURON LINE RD | 4 | | LEPPEK | 4 | | LESLIE RD | 4 | | MAURER RD | 4 | | MCMILLAN RD | 4 | | WHEELER RD | 4 | | 1179 E. HURON LINE RD | 2 | | 1510 ATWATER RD | 2 | | 1621 W WADSWORTH RD | 2 | | 1640 E WWADSWORTH RD | 2 | | 1781 WADSWORTH | 2 | | 187 MORRISON ROAD | 2 | | 2131 WEAVER ST | 2 | | 2255 LEPPEK RD | 2 | | 2454 E ATWATER | 2 | | 2585 BADAXE ROAD | 2 |
| | | Fire incidents reported |
|---|
| Sreet name | Count |
|---|
| 2638 EAST ATWATER ROAD | 2 | | 2691 CUMBER RD | 2 | | 2741 SOUTH UBLY RD | 2 | | 2742 W MCYNTIRE RD | 2 | | 2850 MCALLISTER ROAD | 2 | | 3225 POLK ROAD ST | 2 | | 3254 S VERONA RD | 2 | | 3365 PURDY ROAD | 2 | | 3720 S. BAD AXE RD | 2 | | 4026 HOLBROOK ROAD | 2 | | 4151 SPENCER RD | 2 | | 4248 STAMBAUGH RD | 2 | | 4250 NUGENT RD | 2 | | 4330 W HURON LINE RD | 2 | | 4368 WASHINGTON ST | 2 | | 4458 ATWATER ROAD ST | 2 | | 4627 FRANKLIN | 2 | | 4637 WASHINGTON ST | 2 | | 4655 PERUSKI ROAD ST | 2 | | 4695 PERUSKI RD | 2 | | 4718 JURGESS RD | 2 | | 4767 S UBLY RD | 2 | | 4821 S BADAXE RD | 2 | | 4905 NUGENT ROAD | 2 | | |
|
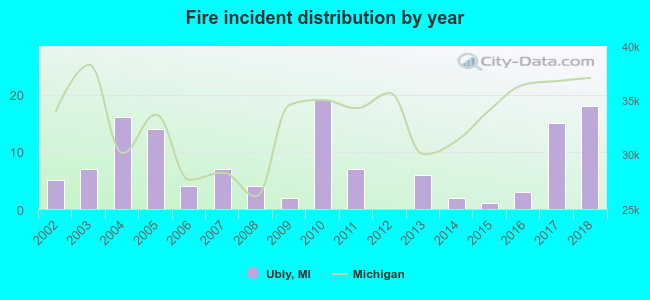 Based on the data from the years 2002 - 2018 the average number of fire incidents per year is 8. The highest number of reported fire incidents - 19 took place in 2010, and the least - 0 in 2012. The data has a rising trend.
 23.8% incidents where reported in the morning and 76.2% in the evening. The most fires (20.8%) took place on Sunday, and the least (8.5%) on Thursday.
 According to the 130 fire incidents from years 2002 - 2018 most fires (14.6%) took place during April, and the least (5.4%) in February.
 Out of all 217 cases reported during the years 2002 - 2018, the most belonged to the categories: Fire (59.9%), Rescue & EMS (18.9%), and Overpressure Rupture (15.2%).
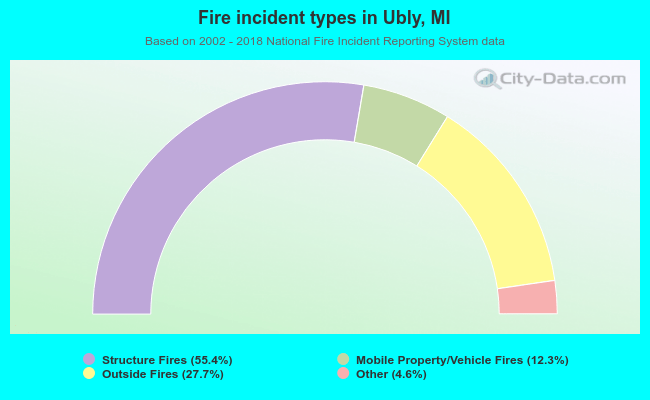 When looking into fire subcategories, the most incidents belonged to: Structure Fires (55.4%), and Outside Fires (27.7%).