| Fire incidents reported |
|---|
| Sreet name | Count |
|---|
| STATE ROUTE 106 | 64 | | SR 106 | 40 | | STATE RT. 106 | 18 | | 5TH ST | 12 | | DALBY RD | 12 | | SEATTLE ST | 12 | | 106 HWY | 10 | | HWY 106 | 10 | | ALDERBROOK DR | 8 | | HYLAND DR | 8 | | MCREAVY RD | 8 | | STATE ROUTE 3 | 8 | | 4121 HWY 106 | 6 | | ALDERNEY ST | 6 | | COUNTRY CLUB DR | 6 | | COVEY RUN | 6 | | EASTWOOD LN | 6 | | GREAT BEND DR | 6 | | HEMLOCK PL | 6 | | MAIN ST | 6 | | MASON AVE | 6 | | MCREAVY RD. | 6 | | MICHELLE DR | 6 | | NORTH SHORE RD | 6 | | WEBB HILL RD | 6 |
| | | Fire incidents reported |
|---|
| Sreet name | Count |
|---|
| 10 E ALDERBROOK DR. | 4 | | 643 DALBY RD. | 4 | | COVEY RUN DR | 4 | | GREAT BEND | 4 | | MANZANITA DR | 4 | | MISTY ACRES LN | 4 | | ORRE NOBLES RD | 4 | | PURDY CUTOFF RD | 4 | | RHODODENDRON LN | 4 | | SPINNAKER DR | 4 | | SR 106 HWY | 4 | | SUNSET RIDGE RD | 4 | | SUSAN LN | 4 | | TIMBER TIDES DR. | 4 | | UNION HEIGHTS DR | 4 | | UNION RIDGE RD | 4 | | US HIGHWAY 101 | 4 | | VINE MAPLE LN | 4 | | 1.5 MILES FROM SR 106 ON WEB H | 2 | | 10 E HEMLOCK PL. | 2 | | 106 | 2 | | 106 RT | 2 | | 106 STATE RT | 2 | | 1105 NORTH CEDAR | 2 | | |
|
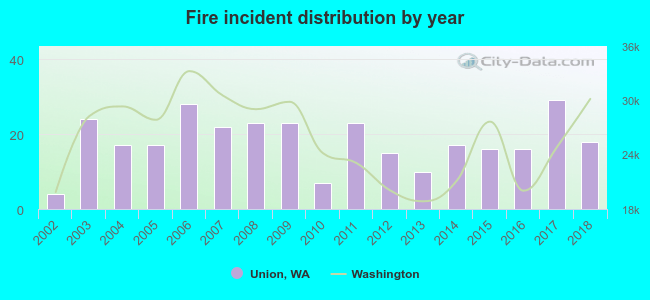 Based on the data from the years 2002 - 2018 the average number of fires per year is 18. The highest number of fire incidents - 29 took place in 2017, and the least - 4 in 2002. The data has an increasing trend.
 32.0% incidents where reported in the morning and 68.0% in the evening. The most fires (20.4%) took place on Wednesday, and the least (12.0%) on Thursday.
 Based on the 309 incident reports from years 2002 - 2018 most fires (23.0%) took place during July, and the least (1.6%) in November.
 Out of all 1,758 cases reported during the years 2002 - 2018, the most belonged to the categories: Rescue & EMS (54.1%), Fire (17.6%), and Service Call (8.9%).
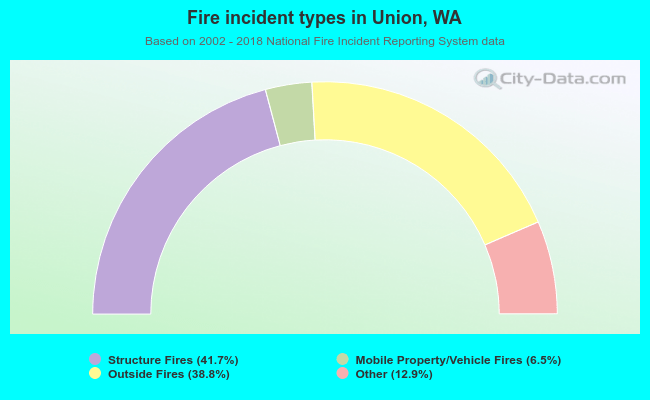 When looking into fire subcategories, the most incidents belonged to: Structure Fires (41.7%), and Outside Fires (38.8%).