Urbana: Fire Incidents, Iowa (IA)
Where are fire incidents reported in Urbana, IA
Something went wrong! Please refresh the page.
|
| |||||||||||||||||||||||||||||||||||||||||||||||||||||||||||||||||||||||||||||||||||||||||||||||||||||||||||||
2002 - 2018 National Fire Incident Reporting System (NFIRS) incidents
- Incident types reported to NFIRS in Urbana, IA
- 21458.6%Fire
- 5013.7%Rescue & EMS
- 4111.2%Hazardous Condition
- 236.3%Good Intent Call
- 154.1%False Alarm
- 113.0%Severe Weather
- 92.5%Service Call
- 20.5%Overpressure Rupture
- Fire incident types reported to NFIRS in Urbana, IA
- 12658.9%Outside Fires
- 4822.4%Mobile Property/Vehicle Fires
- 3516.4%Structure Fires
- 52.3%Other
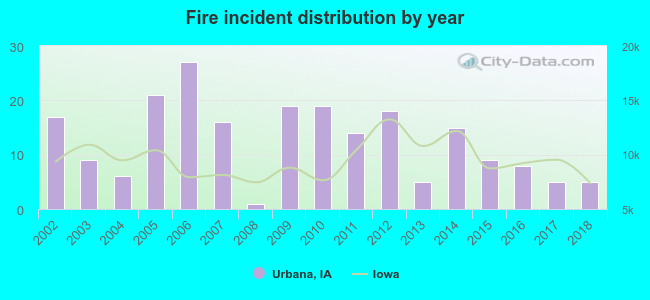 According to the data from the years 2002 - 2018 the average number of fire incidents per year is 13. The highest number of fires - 27 took place in 2006, and the least - 1 in 2008. The data has a decreasing trend.
 29.4% incidents where reported in the morning and 70.6% in the evening. The most fires (22.9%) took place on Saturday, and the least (10.7%) on Thursday.
 Based on the 214 fires from years 2002 - 2018 most fires (19.6%) took place during April, and the least (3.3%) in February.
 Out of all 365 cases reported during the years 2002 - 2018, the most belonged to the categories: Fire (58.6%), Rescue & EMS (13.7%), and Hazardous Condition (11.2%).
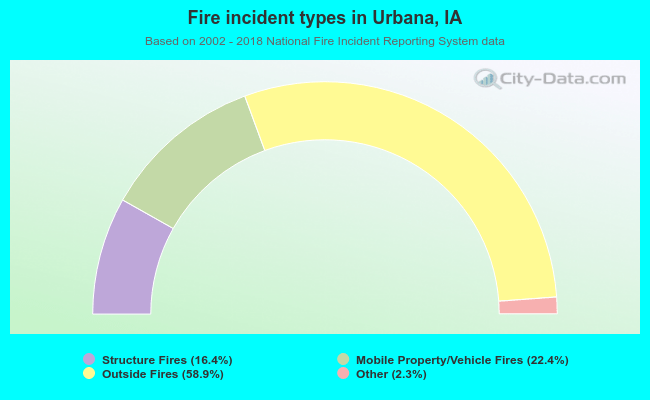 When looking into fire subcategories, the most incidents belonged to: Outside Fires (58.9%), and Mobile Property/Vehicle Fires (22.4%).