| Fire incidents reported |
|---|
| Sreet name | Count |
|---|
| WESTHELP DR | 156 | | GRASSLANDS RD | 138 | | WEST HELP DR | 26 | | BRADHURST AVE | 10 | | COLUMBUS AVE | 10 | | SPRAIN BROOK PKY | 10 | | BROADWAY | 8 | | WESTLAKE DR | 8 | | LAKEVIEW AVENUE | 6 | | OVAL CONNECTOR | 6 | | SKYLINE DR | 6 | | SPRAINBROOK PARKWAY | 6 | | STEPHENS LN | 6 | | THOMAS PL | 6 | | WOODS ROAD | 6 | | BRADHURST AVE | 4 | | COLUMBUS AVE. | 4 | | COMMERCE ST | 4 | | COMMERCE STREET | 4 | | HAMMOND HOUSE ROAD | 4 | | LIVINGSTON AVE | 4 | | RUTLEDGE RD. | 4 | | W CLINTON ST | 4 | | WESTLAKE DR. | 4 | | 9A / DANA RD. | 2 |
| | | Fire incidents reported |
|---|
| Sreet name | Count |
|---|
| BIRCHBROOK DRIVE | 2 | | BRADHURST AVE. | 2 | | BRUCE LN | 2 | | BURNSDALE AVE. | 2 | | CHARLES STREET | 2 | | CLOVEBROOK RD | 2 | | CLOVEBROOK ROAD | 2 | | CLOVER RD. | 2 | | COMMERCE ST. | 2 | | COMMERCE ST | 2 | | E STEVENS AVE | 2 | | EASTVIEW DR. | 2 | | ENTRANCE WAY. | 2 | | FOX HILL RD | 2 | | FOXHILL RD | 2 | | FOXHILL ROAD | 2 | | GALLAWAY PL | 2 | | GALLOWAY LN. | 2 | | GALLOWAY LN. | 2 | | GRASSLAND RD | 2 | | GRASSLANDS | 2 | | GRASSLANDS RD | 2 | | HIGHCLERE LN | 2 | | HOSPITAL OVAL | 2 | | HOSPITAL RD | 2 |
|
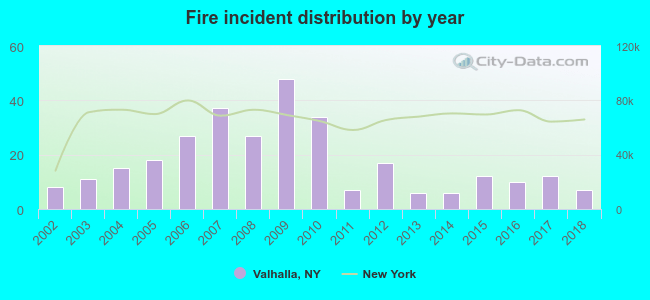 According to the data from the years 2002 - 2018 the average number of fires per year is 18. The highest number of fire incidents - 48 took place in 2009, and the least - 6 in 2013. The data has a decreasing trend.
 34.1% incidents where reported in the morning and 65.9% in the evening. The most fires (17.2%) took place on Thursday, and the least (9.9%) on Sunday.
 According to the 302 reports from years 2002 - 2018 most fires (12.9%) took place during March, and the least (4.6%) in August.
 Out of all 2,321 cases reported during the years 2002 - 2018, the most belonged to the categories: Rescue & EMS (37.6%), False Alarm (22.1%), and Hazardous Condition (17.0%).
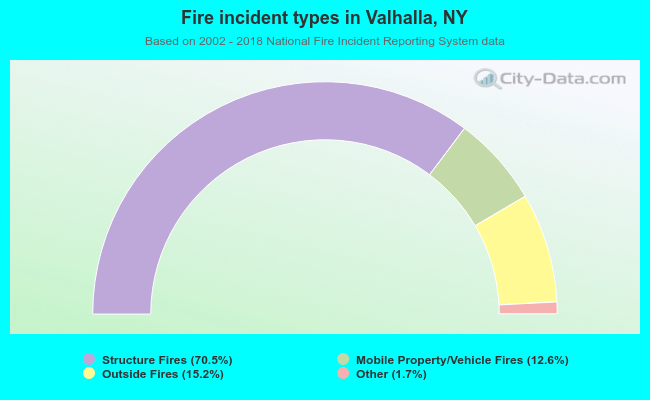 When looking into fire subcategories, the most incidents belonged to: Structure Fires (70.5%), and Outside Fires (15.2%).