Valley Center: Fire Incidents, California (CA)
Where are fire incidents reported in Valley Center, CA
Something went wrong! Please refresh the page.
|
| |||||||||||||||||||||||||||||||||||||||||||||||||||||||||||||||||||||||||||||||||||||||||||||||||||||||||||||
2004 - 2018 National Fire Incident Reporting System (NFIRS) incidents
- Incident types reported to NFIRS in Valley Center, CA
- 4,56468.3%Rescue & EMS
- 96914.5%Good Intent Call
- 5708.5%Service Call
- 3134.7%Fire
- 1332.0%False Alarm
- 941.4%Hazardous Condition
- 340.5%Special Incident
- Fire incident types reported to NFIRS in Valley Center, CA
- 14546.3%Outside Fires
- 9831.3%Structure Fires
- 5818.5%Mobile Property/Vehicle Fires
- 123.8%Other
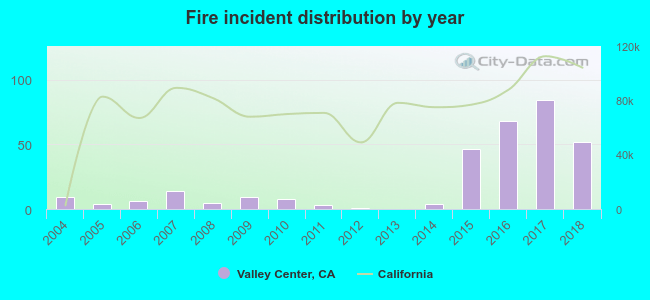 According to the data from the years 2004 - 2018 the average number of fire incidents per year is 21. The highest number of fire incidents - 84 took place in 2017, and the least - 0 in 2013. The data has an increasing trend.
The average number of yearly fire incidents per 10k residents in Valley Center, CA compared to nearest cities:
(Note: Based on data for the last 3 years, including only cities with population 5,000 and above)
| Valley Center: | 73.3 |
| Pauma Valley: | 5.4 |
| Escondido: | 17.9 |
| San Marcos: | 15.0 |
| Vista: | 24.5 |
| Fallbrook: | 36.7 |
| Ramona: | 24.5 |
| Oceanside: | 18.4 |
| Carlsbad: | 13.8 |

 36.7% incidents where reported in the morning and 63.3% in the evening. The most fires (19.2%) took place on Saturday, and the least (8.6%) on Thursday.
 Based on the 313 fires from years 2004 - 2018 most fires (13.7%) took place during October, and the least (4.8%) in January.
 Out of all 6,680 cases reported during the years 2004 - 2018, the most belonged to the categories: Rescue & EMS (68.3%), Good Intent Call (14.5%), and Service Call (8.5%).
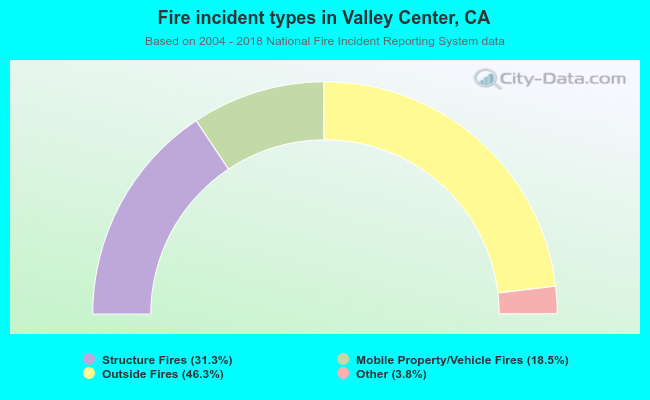 When looking into fire subcategories, the most incidents belonged to: Outside Fires (46.3%), and Structure Fires (31.3%).