| Fire incidents reported |
|---|
| Sreet name | Count |
|---|
| RT 15 | 14 | | HOLLY BUSH RD | 10 | | MARPLE RD | 6 | | SENECA TRAIL | 6 | | VALLEY FORK ROAD | 6 | | 22 MONTERVILLE | 4 | | 24944 SENECA TRAIL | 4 | | 796 BRADY GATE RD | 4 | | CONLEY RUN ROAD | 4 | | DRY BRANCH RD | 4 | | DRY BRANCH ROAD | 4 | | MINGO FLATS | 4 | | MONTERVILLE | 4 | | PAINTERTOWN ROAD | 4 | | POINT MOUNTAIN | 4 | | ROUTE 15 | 4 | | RT 15 MONTERVILLE | 4 | | RT219 SOUTH | 4 | | TURKEY BONE ROAD | 4 | | US RT. 219 | 4 | | WINDY RUN | 4 | | 06 VALLEY HEAD | 2 | | 1 MONTERVILLE ROAD | 2 | | 1 RT 219 | 2 | | 1 WOODS RUN | 2 |
| | | Fire incidents reported |
|---|
| Sreet name | Count |
|---|
| 108 US 219S | 2 | | 159 US 219 | 2 | | 176 LOGAN RUN ROAD | 2 | | 176LOGAN RUN ROAD | 2 | | 185 RALSTON RUN RD RD | 2 | | 219 NORTH | 2 | | 219 NORTH | 2 | | 219 NORTH CONLEY RUN | 2 | | 219 NORTH CONNLEY RUN | 2 | | 219 SOUTH | 2 | | 219 SOUTH MACE MT | 2 | | 219 SOUTH MINGO | 2 | | 24526 SENICA TRAIL | 2 | | 25097 SENECA TRAIL | 2 | | 25493 SENECA TRAIL | 2 | | 29 LOGAN RUN | 2 | | 3 MILES S OF ELKWATER BRIDGE | 2 | | 3 US 219 | 2 | | 3 US 219 RT | 2 | | 37 PAINTERTOWN ROAD | 2 | | 4 DRY RIDGE ROAD | 2 | | 4 STARCHER ROAD | 2 | | 4 WINDY RUN RD | 2 | | 42 VALLEY HEAD | 2 | | 5 DRY RIDGE RD | 2 |
|
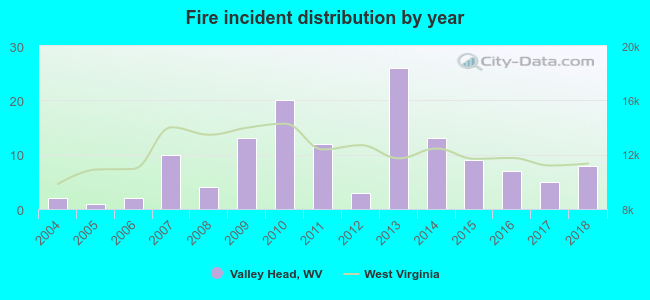 Based on the data from the years 2004 - 2018 the average number of fires per year is 9. The highest number of reported fires - 26 took place in 2013, and the least - 1 in 2005. The data has a growing trend.
 31.9% incidents where reported in the morning and 68.1% in the evening. The most fires (19.3%) took place on Monday, and the least (8.1%) on Tuesday.
 According to the 135 incident reports from years 2004 - 2018 most fires (15.6%) took place during February, and the least (3.0%) in September.
 Out of all 321 cases reported during the years 2004 - 2018, the most belonged to the categories: Fire (42.1%), Rescue & EMS (34.3%), and Good Intent Call (13.4%).
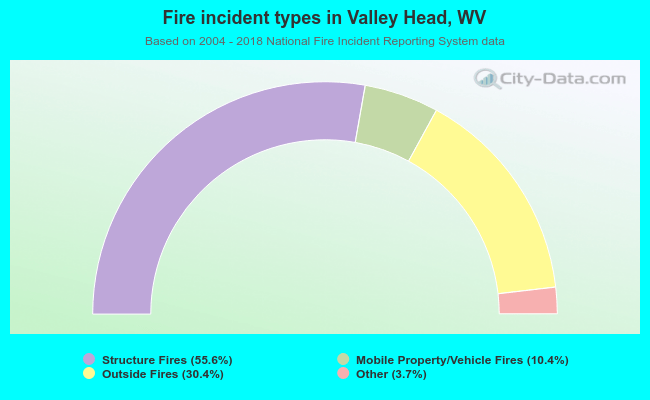 When looking into fire subcategories, the most incidents belonged to: Structure Fires (55.6%), and Outside Fires (30.4%).