Vandalia: Fire Incidents, Michigan (MI)
Where are fire incidents reported in Vandalia, MI
Something went wrong! Please refresh the page.
|
| |||||||||||||||||||||||||||||||||||||||||||||||||||||||||||||||||||||||||||||||||||||||||||||||||||||||||||||
2002 - 2018 National Fire Incident Reporting System (NFIRS) incidents
- Incident types reported to NFIRS in Vandalia, MI
- 19145.0%Fire
- 9221.7%Hazardous Condition
- 4610.8%Rescue & EMS
- 389.0%Good Intent Call
- 368.5%Service Call
- 194.5%False Alarm
- 10.2%Severe Weather
- 10.2%Special Incident
- Fire incident types reported to NFIRS in Vandalia, MI
- 8242.9%Structure Fires
- 7539.3%Outside Fires
- 3216.8%Mobile Property/Vehicle Fires
- 21.0%Other
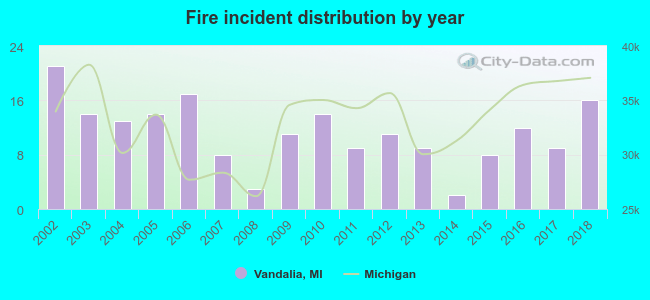 Based on the data from the years 2002 - 2018 the average number of fire incidents per year is 11. The highest number of reported fire incidents - 21 took place in 2002, and the least - 2 in 2014. The data has a declining trend.
 According to the data from the years 2002 - 2018 the average number of fire-related fatalities per year is 0. The highest number of reported deaths - 2 took place in 2008, and the lowest - 0 in 2002. The data has a constant trend.
 28.3% incidents where reported in the morning and 71.7% in the evening. The most fires (19.4%) took place on Saturday, and the least (7.9%) on Thursday.
 Based on the 191 fire incidents from years 2002 - 2018 most fires (18.3%) took place during April, and the least (3.1%) in August.
 Out of all 424 cases reported during the years 2002 - 2018, the most belonged to the categories: Fire (45.0%), Rescue & EMS (21.7%), and Overpressure Rupture (10.8%).
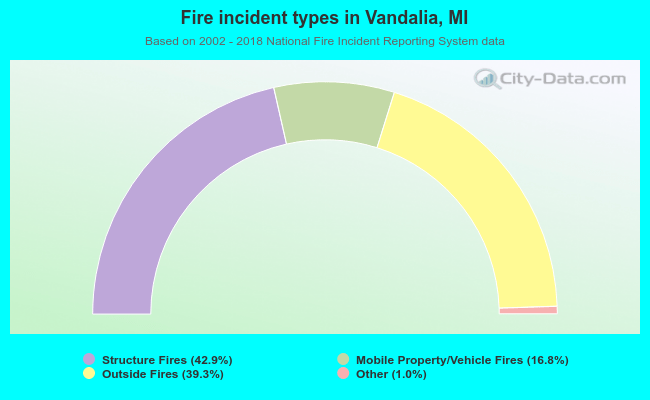 When looking into fire subcategories, the most reports belonged to: Structure Fires (42.9%), and Outside Fires (39.3%).