Vermilion: Fire Incidents, Ohio (OH)
Where are fire incidents reported in Vermilion, OH
Something went wrong! Please refresh the page.
| Fire incidents reported | |
|---|---|
| Sreet name | Count |
| LIBERTY AVE | 134 |
| DARROW RD | 82 |
| WEST LAKE RD | 68 |
| STATE ROUTE 60 HWY | 52 |
| MASON RD | 34 |
| JOPPA RD | 28 |
| WEST RIVER RD | 28 |
| CLAUS RD | 26 |
| COOPER FOSTER PARK RD | 26 |
| OHIO TURNPIKE TPKE | 26 |
| BARNES RD | 24 |
| COEN RD | 24 |
| POORMAN RD | 24 |
| SOUTH ST | 24 |
| SPERRY RD | 24 |
| VERMILION RD | 24 |
| FURNACE RD | 22 |
| SUNNYSIDE RD | 22 |
| THOMPSON RD | 22 |
| CLEVELAND RD | 20 |
| BAUMHART RD | 18 |
| EDGEWATER BLVD | 18 |
| LAKE RD | 18 |
| RIDGE RD | 18 |
| SALEM DR | 18 |
| DOUGLAS ST | 16 |
| EDGEWATER DR | 16 |
| JERUSALEM RD | 16 |
| KNEISEL RD | 16 |
| NORTH RIDGE RD | 16 |
| Other | 45 |
2002 - 2018 National Fire Incident Reporting System (NFIRS) incidents
- Incident types reported to NFIRS in Vermilion, OH
- 1,51036.0%Rescue & EMS
- 1,10726.4%Hazardous Condition
- 94922.6%Fire
- 3157.5%False Alarm
- 1603.8%Good Intent Call
- 1202.9%Service Call
- 270.6%Overpressure Rupture
- 60.1%Severe Weather
- 50.1%Special Incident
- Fire incident types reported to NFIRS in Vermilion, OH
- 40742.9%Structure Fires
- 33635.4%Outside Fires
- 19020.0%Mobile Property/Vehicle Fires
- 161.7%Other
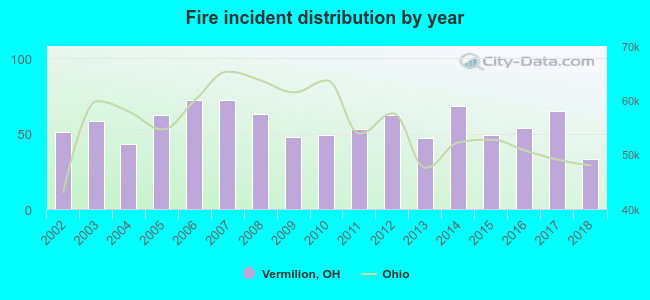 Based on the data from the years 2002 - 2018 the average number of fires per year is 56. The highest number of fire incidents - 72 took place in 2006, and the least - 33 in 2018. The data has a decreasing trend.
The average number of yearly fire incidents per 10k residents in Vermilion, OH compared to nearest cities:
(Note: Based on data for the last 3 years, including only cities with population 5,000 and above)
| Vermilion: | 48.4 |
| Amherst: | 59.8 |
| Lorain: | 54.4 |
| Oberlin: | 58.6 |
| Huron: | 36.4 |
| Elyria: | 32.0 |
| Sheffield Lake: | 48.2 |
| Avon: | 32.6 |
| North Ridgeville: | 19.5 |
 The median response time based on all reported fire incidents is 8 minutes. This is higher compared to the state median value.
The median response time in Vermilion, OH compared to nearest cities:
(Note: Based on data for all years, including only cities with at least 500 fire incidents)
| Vermilion: | 8 minutes |
| Amherst: | 9 minutes |
| Lorain: | 5 minutes |
| Oberlin: | 6 minutes |
| Huron: | 6 minutes |
| Elyria: | 5 minutes |
| Sheffield Lake: | 6 minutes |
| Avon: | 7 minutes |
| North Ridgeville: | 6 minutes |
 Based on the data from the years 2002 - 2018 the average number of fire-related fatalities per year is 0. The highest number of deaths - 2 took place in 2005, and the lowest - 0 in 2002. The data has a constant trend.
 Based on the data from the years 2002 - 2018 the average number of fire-related yearly casualties is 1. The highest number of casualties - 4 took place in 2008, and the lowest - 0 in 2005. The data has a constant trend.
The average number of casualties per 1,000 fire incidents is 15. This indicator was the highest - 63 in 2008, and the lowest 0 in 2005. The trend for injuries per 1,000 incidents is growing. Compared to the Ohio value the number of casualties per 1,000 fires is about the same.
Based on the data from the years 2002 - 2018 the average number of fire-related yearly casualties is 1. The highest number of casualties - 4 took place in 2008, and the lowest - 0 in 2005. The data has a constant trend.
The average number of casualties per 1,000 fire incidents is 15. This indicator was the highest - 63 in 2008, and the lowest 0 in 2005. The trend for injuries per 1,000 incidents is growing. Compared to the Ohio value the number of casualties per 1,000 fires is about the same.Casualties per 1,000 incidents in Vermilion, OH compared to nearest cities:
(Note: Based on data for all years, including only cities with at least 500 fire incidents)
| Vermilion: | 14.8 |
| Amherst: | 8.3 |
| Lorain: | 20.8 |
| Oberlin: | 18.5 |
| Huron: | 27.3 |
| Elyria: | 34.0 |
| Sheffield Lake: | 22.5 |
| Avon: | 16.3 |
| North Ridgeville: | 11.0 |
 29.5% incidents where reported in the morning and 70.5% in the evening. The most fires (19.0%) took place on Sunday, and the least (11.5%) on Tuesday.
 According to the 949 fire incident reports from years 2002 - 2018 most fires (13.0%) took place during April, and the least (5.7%) in January.
 Out of all 4,199 cases reported during the years 2002 - 2018, the most belonged to the categories: Rescue & EMS (36.0%), Hazardous Condition (26.4%), and Fire (22.6%).
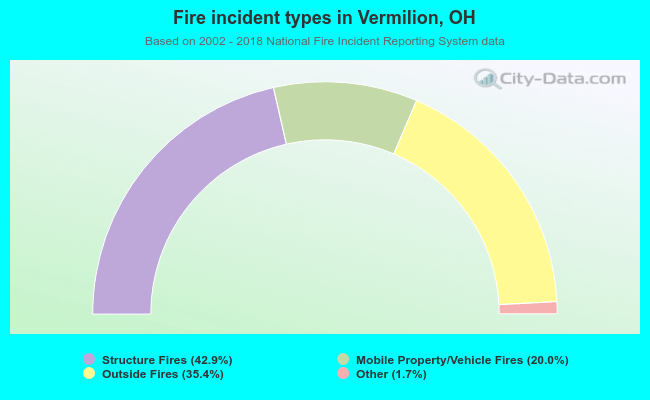 When looking into fire subcategories, the most reports belonged to: Structure Fires (42.9%), and Outside Fires (35.4%).