Vero Beach: Fire Incidents, Florida (FL)
Where are fire incidents reported in Vero Beach, FL
Something went wrong! Please refresh the page.
| Fire incidents reported | |
|---|---|
| Sreet name | Count |
| 20TH ST | 414 |
| 95 | 386 |
| U S HIGHWAY 1 | 306 |
| OLD DIXIE HWY | 190 |
| 58TH AVE | 182 |
| 27TH AVE | 176 |
| 9TH ST | 170 |
| 8TH ST | 146 |
| 45TH ST | 136 |
| 20TH AVE | 134 |
| STATE ROAD 60 | 134 |
| 43RD AVE | 122 |
| 90TH AVE | 118 |
| 66TH AVE | 102 |
| 12TH ST | 98 |
| U.S. HIGHWAY 1 | 98 |
| 4TH ST | 88 |
| 16TH ST | 76 |
| 1ST ST | 76 |
| 21ST ST | 74 |
| INDIAN RIVER BLVD | 74 |
| 17TH ST | 70 |
| 33RD AVE | 70 |
| 85TH ST | 70 |
| 41ST ST | 68 |
| 82ND AVE | 68 |
| 5TH ST | 66 |
| 14TH AVE | 64 |
| HIGHWAY A1A | 64 |
| 37TH ST | 62 |
| Other | 2,085 |
2002 - 2018 National Fire Incident Reporting System (NFIRS) incidents
- Incident types reported to NFIRS in Vero Beach, FL
- 79,94774.5%Rescue & EMS
- 8,8908.3%Hazardous Condition
- 5,9875.6%Fire
- 5,2684.9%False Alarm
- 4,9034.6%Good Intent Call
- 2,1532.0%Service Call
- 1220.1%Special Incident
- Fire incident types reported to NFIRS in Vero Beach, FL
- 3,80863.6%Outside Fires
- 1,20920.2%Structure Fires
- 90415.1%Mobile Property/Vehicle Fires
- 661.1%Other
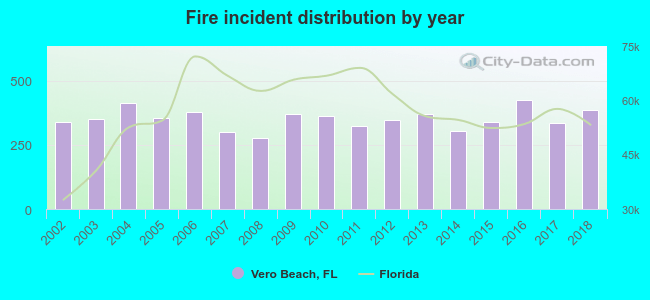 According to the data from the years 2002 - 2018 the average number of fire incidents per year is 352. The highest number of fires - 424 took place in 2016, and the least - 276 in 2008. The data has an increasing trend.
The average number of yearly fire incidents per 10k residents in Vero Beach, FL compared to nearest cities:
(Note: Based on data for the last 3 years, including only cities with population 5,000 and above)
| Vero Beach: | 238.7 |
| Sebastian: | 27.4 |
| Fort Pierce: | 123.2 |
| Fellsmere: | 52.7 |
| Micco: | 28.0 |
| Palm Bay: | 33.4 |
| Jensen Beach: | 27.0 |
| Stuart: | 46.7 |
| Palm City: | 21.5 |
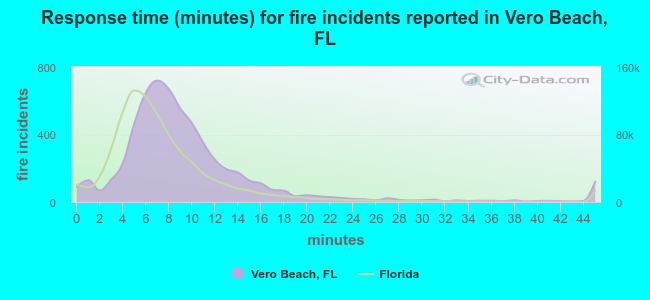 The median response time based on all reported fire incidents is 8 minutes. This is higher compared to the state median value.
The median response time in Vero Beach, FL compared to nearest cities:
(Note: Based on data for all years, including only cities with at least 500 fire incidents)
| Vero Beach: | 8 minutes |
| Sebastian: | 8 minutes |
| Fort Pierce: | 9 minutes |
| Fellsmere: | 8 minutes |
| Malabar: | 6 minutes |
| Palm Bay: | 7 minutes |
| Jensen Beach: | 8 minutes |
| Stuart: | 7 minutes |
| Palm City: | 11 minutes |
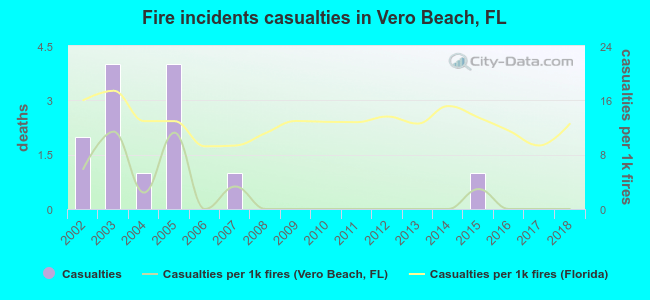 Based on the data from the years 2002 - 2018 the average number of fire-related yearly casualties is 1. The highest number of reported casualties - 4 took place in 2003, and the lowest - 0 in 2006. The data has a dropping trend.
The average number of casualties per 1,000 fires is 2. This indicator was the highest - 11 in 2003, and the lowest 0 in 2006. The trend for injuries per 1,000 fire incidents is dropping. Compared to the state value the number of casualties per 1,000 incidents is much lower.
Based on the data from the years 2002 - 2018 the average number of fire-related yearly casualties is 1. The highest number of reported casualties - 4 took place in 2003, and the lowest - 0 in 2006. The data has a dropping trend.
The average number of casualties per 1,000 fires is 2. This indicator was the highest - 11 in 2003, and the lowest 0 in 2006. The trend for injuries per 1,000 fire incidents is dropping. Compared to the state value the number of casualties per 1,000 incidents is much lower.Casualties per 1,000 incidents in Vero Beach, FL compared to nearest cities:
(Note: Based on data for all years, including only cities with at least 500 fire incidents)
| Vero Beach: | 2.2 |
| Sebastian: | 1.0 |
| Fort Pierce: | 2.6 |
| Fellsmere: | 0.0 |
| Malabar: | 1.8 |
| Palm Bay: | 11.5 |
| Jensen Beach: | 9.0 |
| Stuart: | 10.3 |
| Palm City: | 11.7 |
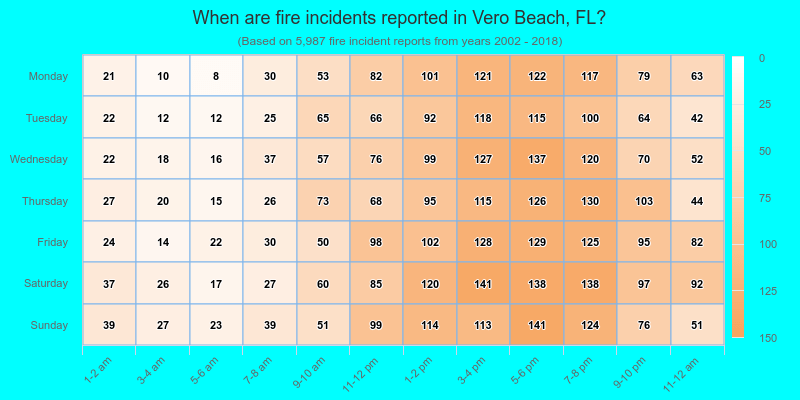
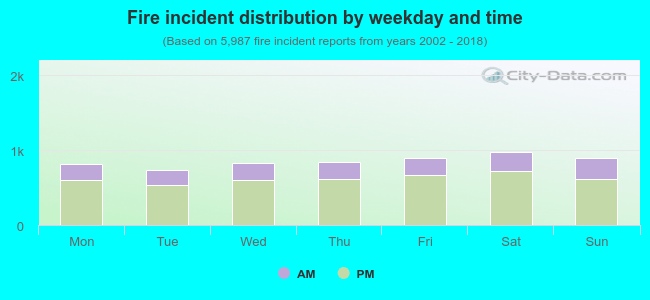 27.2% incidents where reported in the morning and 72.8% in the evening. The most fires (16.3%) took place on Saturday, and the least (12.2%) on Tuesday.
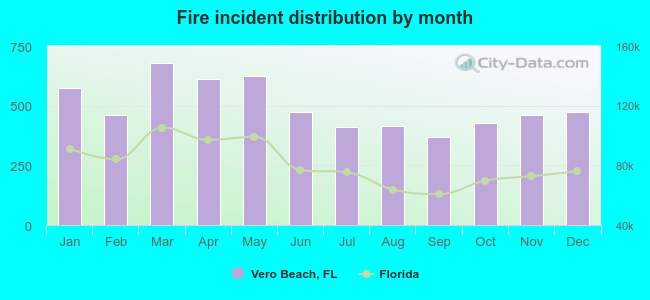 Based on the 5,987 fire incident reports from years 2002 - 2018 most fires (11.3%) took place during March, and the least (6.2%) in September.
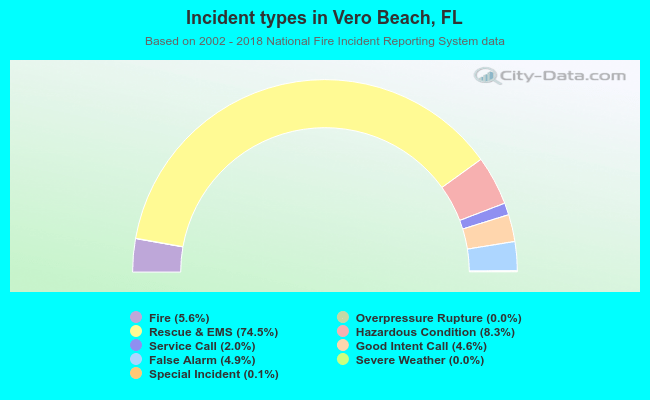 Out of all 107,354 cases reported during the years 2002 - 2018, the most belonged to the categories: Rescue & EMS (74.5%), Hazardous Condition (8.3%), and Fire (5.6%).
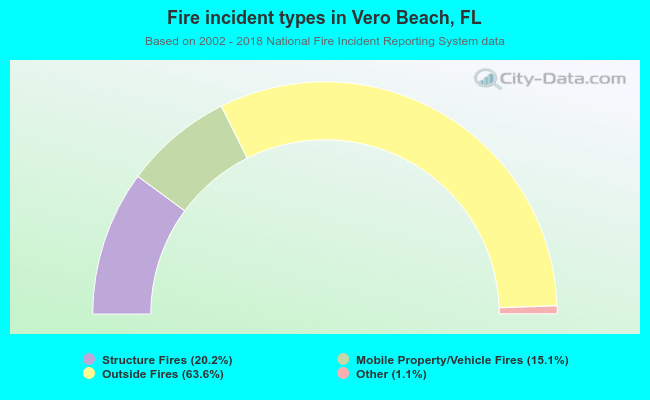 When looking into fire subcategories, the most incidents belonged to: Outside Fires (63.6%), and Structure Fires (20.2%).