Villa Park: Fire Incidents, Illinois (IL)
Where are fire incidents reported in Villa Park, IL
Something went wrong! Please refresh the page.
| Fire incidents reported | |
|---|---|
| Sreet name | Count |
| MICHIGAN | 296 |
| ARDMORE | 290 |
| NORTH | 230 |
| HIGHLAND | 156 |
| ROOSEVELT | 154 |
| VILLA | 148 |
| YALE | 114 |
| DIVISION | 90 |
| HARVARD | 88 |
| PRINCETON | 84 |
| CORNELL | 66 |
| WISCONSIN | 58 |
| ADDISON RD | 54 |
| TERRACE | 52 |
| ST. CHARLES | 48 |
| OVALTINE CT | 46 |
| PARK | 44 |
| ST CHARLES | 44 |
| ELM | 40 |
| NORTH AVE | 38 |
| ILLINOIS | 34 |
| MONTEREY | 34 |
| VERMONT | 34 |
| MICHIGAN AVE | 30 |
| RT. 83 | 30 |
| SUMMIT | 30 |
| EUCLID | 28 |
| ARDMORE AVE | 26 |
| IOWA | 26 |
| OAKLAND | 26 |
2002 - 2018 National Fire Incident Reporting System (NFIRS) incidents
- Incident types reported to NFIRS in Villa Park, IL
- 11,45557.6%Rescue & EMS
- 2,10510.6%Hazardous Condition
- 1,7568.8%Fire
- 1,6538.3%Service Call
- 1,5727.9%False Alarm
- 1,3246.7%Good Intent Call
- Fire incident types reported to NFIRS in Villa Park, IL
- 1,10162.7%Structure Fires
- 43925.0%Outside Fires
- 17910.2%Mobile Property/Vehicle Fires
- 372.1%Other
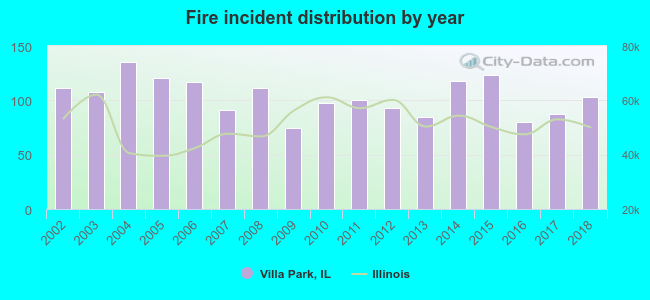 According to the data from the years 2002 - 2018 the average number of fire incidents per year is 103. The highest number of reported fires - 135 took place in 2004, and the least - 75 in 2009. The data has a decreasing trend.
The average number of yearly fire incidents per 10k residents in Villa Park, IL compared to nearest cities:
(Note: Based on data for the last 3 years, including only cities with population 5,000 and above)
| Villa Park: | 40.8 |
| Elmhurst: | 18.9 |
| Lombard: | 27.0 |
| Addison: | 33.4 |
| Berkeley: | 82.2 |
| Oak Brook: | 71.9 |
| Hillside: | 67.1 |
| Northlake: | 33.7 |
| Glen Ellyn: | 26.9 |
 The median response time based on all reported fire incidents is 4 minutes. This is lower than the Illinois median value.
The median response time in Villa Park, IL compared to nearest cities:
(Note: Based on data for all years, including only cities with at least 500 fire incidents)
| Villa Park: | 4 minutes |
| Elmhurst: | 5 minutes |
| Lombard: | 5 minutes |
| Addison: | 5 minutes |
| Berkeley: | 4 minutes |
| Oak Brook: | 5 minutes |
| Hillside: | 4 minutes |
| Northlake: | 5 minutes |
| Glen Ellyn: | 6 minutes |
 According to the data from the years 2002 - 2018 the average number of fire-related yearly deaths is 0. The highest number of reported deaths - 1 took place in 2005, and the lowest - 0 in 2002. The data has an increasing trend.
 Based on the data from the years 2002 - 2018 the average number of fire-related yearly casualties is 3. The highest number of casualties - 8 took place in 2015, and the lowest - 0 in 2006. The data has a growing trend.
The average number of casualties per 1,000 fires is 26. This indicator was the highest - 65 in 2015, and the lowest 0 in 2006. The trend for injuries per 1,000 fires is increasing. Compared to the Illinois value the number of injuries per 1,000 fire incidents is much higher.
Based on the data from the years 2002 - 2018 the average number of fire-related yearly casualties is 3. The highest number of casualties - 8 took place in 2015, and the lowest - 0 in 2006. The data has a growing trend.
The average number of casualties per 1,000 fires is 26. This indicator was the highest - 65 in 2015, and the lowest 0 in 2006. The trend for injuries per 1,000 fires is increasing. Compared to the Illinois value the number of injuries per 1,000 fire incidents is much higher.
 28.7% incidents where reported in the morning and 71.3% in the evening. The most fires (17.9%) took place on Sunday, and the least (11.6%) on Tuesday.
 According to the 1,756 fires from years 2002 - 2018 most fires (9.9%) took place during January, and the least (6.7%) in September.
 Out of all 19,897 cases reported during the years 2002 - 2018, the most belonged to the categories: Rescue & EMS (57.6%), Hazardous Condition (10.6%), and Fire (8.8%).
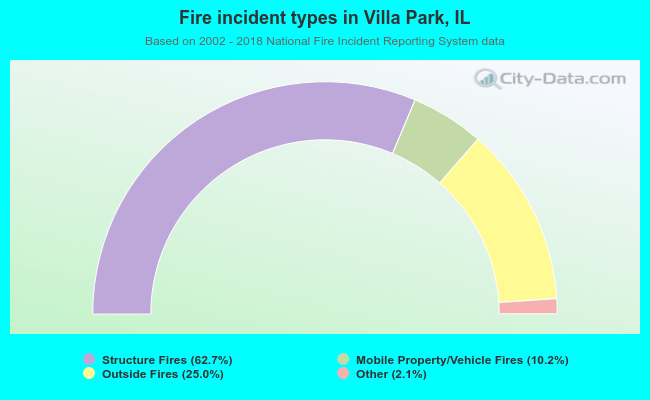 When looking into fire subcategories, the most incidents belonged to: Structure Fires (62.7%), and Outside Fires (25.0%).