Von Ormy: Fire Incidents, Texas (TX)
Where are fire incidents reported in Von Ormy, TX
Something went wrong! Please refresh the page.
|
| |||||||||||||||||||||||||||||||||||||||||||||||||||||||||||||||||||||||||||||||||||||||||||||||||||||||||||||
2003 - 2018 National Fire Incident Reporting System (NFIRS) incidents
- Incident types reported to NFIRS in Von Ormy, TX
- 63831.5%Fire
- 57428.4%Rescue & EMS
- 36217.9%Service Call
- 31615.6%Good Intent Call
- 1205.9%Hazardous Condition
- 120.6%False Alarm
- Fire incident types reported to NFIRS in Von Ormy, TX
- 38059.6%Outside Fires
- 11718.3%Structure Fires
- 10516.5%Mobile Property/Vehicle Fires
- 365.6%Other
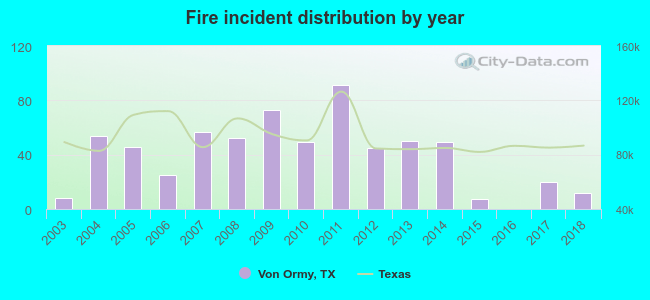 According to the data from the years 2003 - 2018 the average number of fires per year is 40. The highest number of fire incidents - 91 took place in 2011, and the least - 0 in 2016. The data has a growing trend.
 The median response time based on all reported fire incidents is 5 minutes. This is lower compared to the state median value.
The median response time in Von Ormy, TX compared to nearest cities:
(Note: Based on data for all years, including only cities with at least 500 fire incidents)
| Von Ormy: | 5 minutes |
| San Antonio: | 5 minutes |
| Natalia: | 10 minutes |
| Castroville: | 10 minutes |
| Poteet: | 10 minutes |
| Devine: | 12 minutes |
| Helotes: | 7 minutes |
| Pleasanton: | 8 minutes |
| Converse: | 6 minutes |
 30.1% incidents where reported in the morning and 69.9% in the evening. The most fires (16.1%) took place on Thursday, and the least (11.6%) on Sunday.
 Based on the 638 reports from years 2003 - 2018 most fires (11.1%) took place during August, and the least (5.6%) in November.
 Out of all 2,023 cases reported during the years 2003 - 2018, the most belonged to the categories: Fire (31.5%), Overpressure Rupture (28.4%), and Hazardous Condition (17.9%).
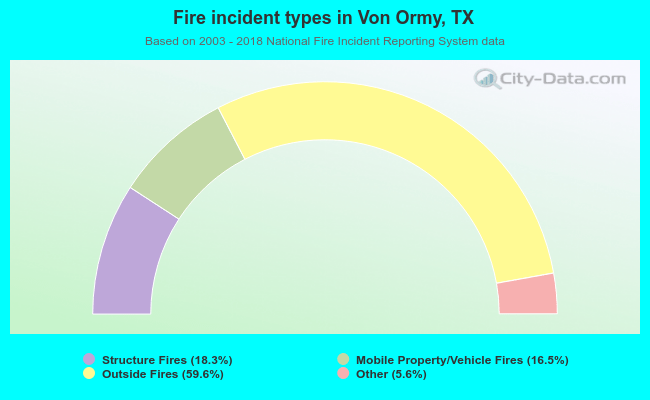 When looking into fire subcategories, the most reports belonged to: Outside Fires (59.6%), and Structure Fires (18.3%).