| Fire incidents reported |
|---|
| Sreet name | Count |
|---|
| DRUMMONDTOWN {11} RD | 20 | | SEASIDE RD | 14 | | DRUMMONDTOWN RD | 12 | | WACHAPREAGUE RD | 10 | | DRUMMONDTOWN RD | 8 | | OLE ROAD | 8 | | POWELLTON AVE | 8 | | TROWER RD | 8 | | ATLANTIC AVE | 6 | | BRADFORD NECK RD | 6 | | BROOKLYN AVE | 6 | | OLE RD | 6 | | POWELLTON AVE | 6 | | TROWER RD | 6 | | ATLANTIC AVENUE | 4 | | LANKFORD HIGHWAY | 4 | | LEE ST | 4 | | MAIN | 4 | | OLE RD | 4 | | PICKPENNY RD. | 4 | | PIGGIN RD | 4 | | ROBINSON CIRCLE | 4 | | SEASIDE ROAD | 4 | | SWITCH BRIDGE RD | 4 | | 19433 DEANS LN | 2 |
| | | Fire incidents reported |
|---|
| Sreet name | Count |
|---|
| 19433 DEANS LANE | 2 | | 19452 ROBINSON CIR | 2 | | 19544 WACHAPREAGUE RD | 2 | | 21397 TROWER RD. | 2 | | 25390 DRUMMONDTOWN RD | 2 | | 30786 DRUMMOND TOWN RD | 2 | | 31463 SEASIDE RD. | 2 | | 32147 BRADFORD NECK RD. | 2 | | AREA OF CHANCETOWN ROAD | 2 | | BAYSIDE RD | 2 | | BAYVIEW AVENUE | 2 | | BENJAMIN BANNEKER STR | 2 | | BOBTOWN RD | 2 | | BRADFORD NECK ROAD | 2 | | BRADFORD RD | 2 | | BRADFORD RD | 2 | | BRADFORD ROAD | 2 | | BURTONS LANE | 2 | | CENTER ST | 2 | | CHURCH | 2 | | CUSTIS STREET | 2 | | DRUMMOND TOWN RD | 2 | | DRUMMOND TOWN RD | 2 | | DRUMMONDTOWN | 2 | | |
|
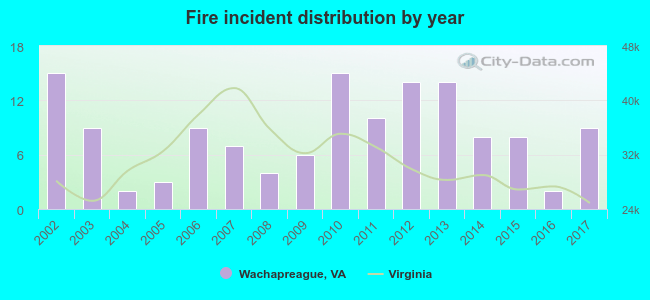 According to the data from the years 2002 - 2017 the average number of fires per year is 8. The highest number of reported fires - 15 took place in 2002, and the least - 2 in 2004. The data has a dropping trend.
 22.2% incidents where reported in the morning and 77.8% in the evening. The most fires (23.0%) took place on Tuesday, and the least (11.1%) on Saturday.
 Based on the 135 fires from years 2002 - 2017 most fires (12.6%) took place during May, and the least (3.7%) in September.
 Out of all 413 cases reported during the years 2002 - 2017, the most belonged to the categories: Overpressure Rupture (44.3%), Fire (32.7%), and Service Call (9.4%).
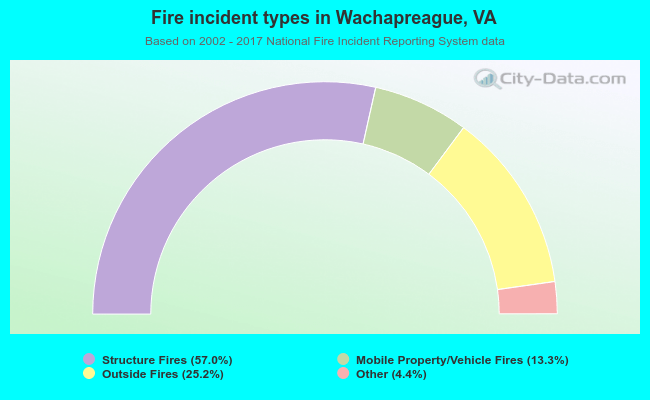 When looking into fire subcategories, the most reports belonged to: Structure Fires (57.0%), and Outside Fires (25.2%).