Wakarusa: Fire Incidents, Kansas (KS)
Where are fire incidents reported in Wakarusa, KS
Something went wrong! Please refresh the page.
|
| |||||||||||||||||||||||||||||||||||||||||||||||||||||||||||||||||||||||||||||||||||||||||||||||||||||||||
2003 - 2018 National Fire Incident Reporting System (NFIRS) incidents
- Incident types reported to NFIRS in Wakarusa, KS
- 15838.3%Fire
- 13733.2%Rescue & EMS
- 6515.7%Good Intent Call
- 225.3%Hazardous Condition
- 174.1%Service Call
- 133.1%False Alarm
- 10.2%Overpressure Rupture
- Fire incident types reported to NFIRS in Wakarusa, KS
- 10969.0%Outside Fires
- 2314.6%Mobile Property/Vehicle Fires
- 2213.9%Structure Fires
- 42.5%Other
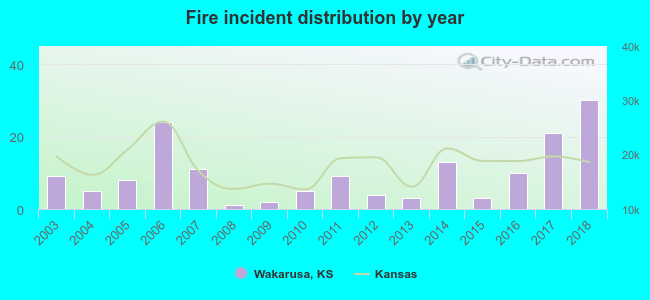 Based on the data from the years 2003 - 2018 the average number of fire incidents per year is 10. The highest number of fires - 30 took place in 2018, and the least - 1 in 2008. The data has a growing trend.
 24.1% incidents where reported in the morning and 75.9% in the evening. The most fires (29.1%) took place on Saturday, and the least (6.3%) on Monday.
 According to the 158 fires from years 2003 - 2018 most fires (25.3%) took place during March, and the least (1.9%) in May.
 Out of all 413 cases reported during the years 2003 - 2018, the most belonged to the categories: Fire (38.3%), Rescue & EMS (33.2%), and Good Intent Call (15.7%).
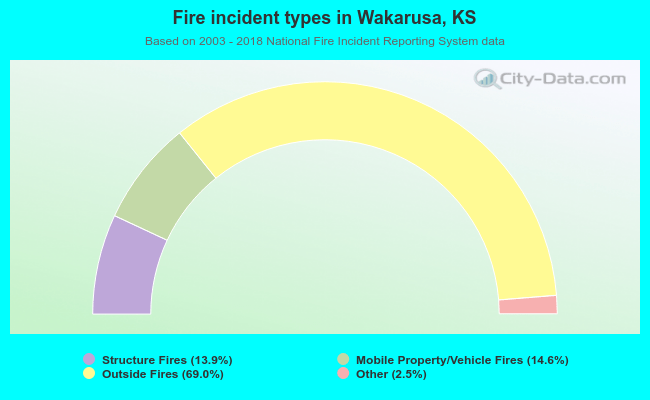 When looking into fire subcategories, the most incidents belonged to: Outside Fires (69.0%), and Mobile Property/Vehicle Fires (14.6%).