Wakeman: Fire Incidents, Ohio (OH)
Where are fire incidents reported in Wakeman, OH
Something went wrong! Please refresh the page.
|
| |||||||||||||||||||||||||||||||||||||||||||||||||||||||||||||||||||||||||||||||||||||||||||||||||||||||||||||
2002 - 2018 National Fire Incident Reporting System (NFIRS) incidents
- Incident types reported to NFIRS in Wakeman, OH
- 49636.4%Fire
- 43331.8%Rescue & EMS
- 16512.1%Hazardous Condition
- 1218.9%Good Intent Call
- 695.1%Service Call
- 443.2%False Alarm
- 272.0%Severe Weather
- 40.3%Overpressure Rupture
- 20.1%Special Incident
- Fire incident types reported to NFIRS in Wakeman, OH
- 26252.8%Structure Fires
- 15631.5%Outside Fires
- 6913.9%Mobile Property/Vehicle Fires
- 91.8%Other
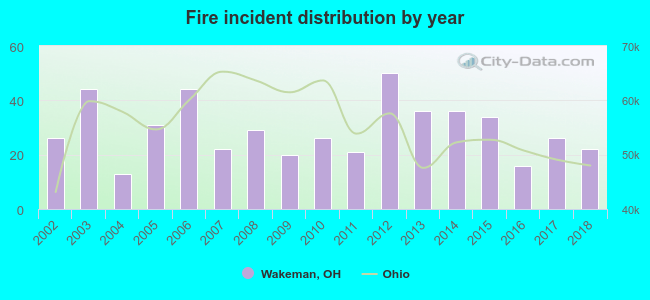 Based on the data from the years 2002 - 2018 the average number of fire incidents per year is 29. The highest number of fires - 50 took place in 2012, and the least - 13 in 2004. The data has a declining trend.
 According to the data from the years 2002 - 2018 the average number of fire-related yearly casualties is 1. The highest number of reported casualties - 5 took place in 2005, and the lowest - 0 in 2004. The data has a declining trend.
 39.5% incidents where reported in the morning and 60.5% in the evening. The most fires (16.1%) took place on Wednesday, and the least (13.3%) on Monday.
 According to the 496 incident reports from years 2002 - 2018 most fires (14.1%) took place during April, and the least (4.2%) in September.
 Out of all 1,361 cases reported during the years 2002 - 2018, the most belonged to the categories: Fire (36.4%), Rescue & EMS (31.8%), and Hazardous Condition (12.1%).
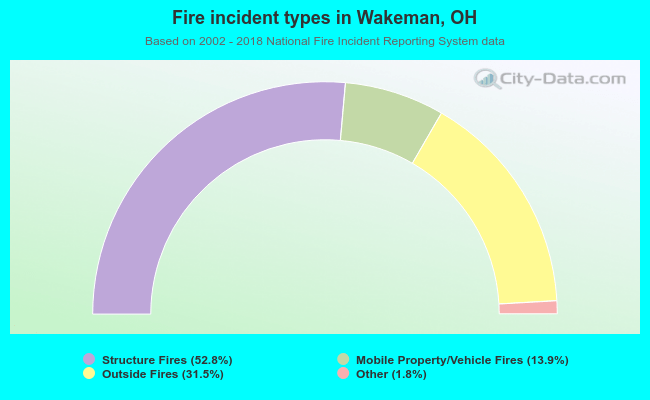 When looking into fire subcategories, the most incidents belonged to: Structure Fires (52.8%), and Outside Fires (31.5%).