Warren: Fire Incidents, Indiana (IN)
Where are fire incidents reported in Warren, IN
Something went wrong! Please refresh the page.
|
| |||||||||||||||||||||||||||||||||||||||||||||||||||||||||||||||||||||||||||||||||||||||||||||||||||||||||||||
2002 - 2018 National Fire Incident Reporting System (NFIRS) incidents
- Incident types reported to NFIRS in Warren, IN
- 45341.1%Rescue & EMS
- 39936.2%Fire
- 817.4%Good Intent Call
- 726.5%Special Incident
- 605.4%Hazardous Condition
- 181.6%False Alarm
- 161.5%Service Call
- 20.2%Overpressure Rupture
- Fire incident types reported to NFIRS in Warren, IN
- 14335.8%Structure Fires
- 12330.8%Outside Fires
- 11328.3%Mobile Property/Vehicle Fires
- 205.0%Other
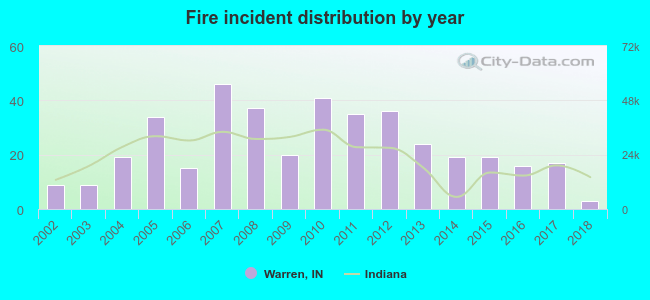 According to the data from the years 2002 - 2018 the average number of fires per year is 23. The highest number of fires - 46 took place in 2007, and the least - 3 in 2018. The data has a dropping trend.
 33.3% incidents where reported in the morning and 66.7% in the evening. The most fires (17.5%) took place on Sunday, and the least (11.0%) on Monday.
 According to the 399 fire incident reports from years 2002 - 2018 most fires (14.5%) took place during April, and the least (5.0%) in May.
 Out of all 1,102 cases reported during the years 2002 - 2018, the most belonged to the categories: Rescue & EMS (41.1%), Fire (36.2%), and Good Intent Call (7.4%).
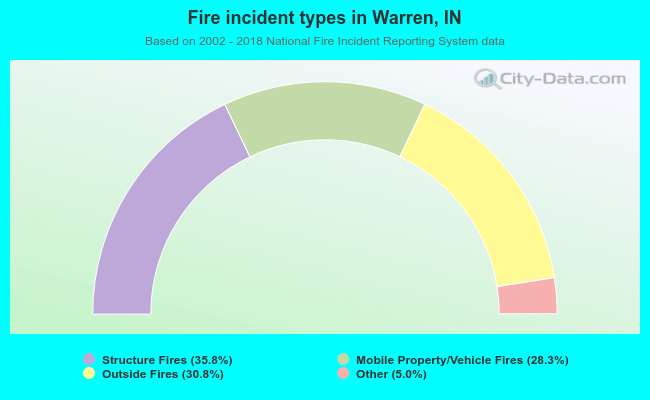 When looking into fire subcategories, the most reports belonged to: Structure Fires (35.8%), and Outside Fires (30.8%).