Waterville: Fire Incidents, Maine (ME)
Where are fire incidents reported in Waterville, ME
Something went wrong! Please refresh the page.
| Fire incidents reported | |
|---|---|
| Sreet name | Count |
| COLLEGE AVE | 200 |
| KENNEDY MEMORIAL DR | 190 |
| WATERVILLE COMMONS DR | 128 |
| MAIN ST | 106 |
| SUMMER ST | 78 |
| WATER ST | 72 |
| ELM ST | 66 |
| SILVER ST | 66 |
| WEST RIVER RD | 60 |
| WESTERN AVE | 52 |
| MAYFLOWER HILL DR | 50 |
| COLLEGE (54+) AVE | 46 |
| FRONT ST | 46 |
| CRESTWOOD DR | 38 |
| PLEASANT ST | 38 |
| TRAFTON RD | 34 |
| DRUMMOND AVE | 30 |
| ELM PLZ | 30 |
| GOLD ST | 28 |
| CONCOURSE | 26 |
| I95 | 26 |
| CAREY LN | 24 |
| I-95 | 24 |
| JFK PLZ | 22 |
| OAK ST | 20 |
| ARMORY RD | 18 |
| MAIN (1-242) ST | 18 |
| MAIN (242-) ST | 18 |
| NORTH ST | 18 |
| TICONIC ST | 18 |
2003 - 2018 National Fire Incident Reporting System (NFIRS) incidents
- Incident types reported to NFIRS in Waterville, ME
- 10,70164.3%Rescue & EMS
- 1,5249.2%Hazardous Condition
- 1,4078.5%Fire
- 1,2117.3%Good Intent Call
- 9545.7%False Alarm
- 7934.8%Service Call
- 380.2%Special Incident
- Fire incident types reported to NFIRS in Waterville, ME
- 76054.0%Structure Fires
- 40028.4%Outside Fires
- 17412.4%Mobile Property/Vehicle Fires
- 735.2%Other
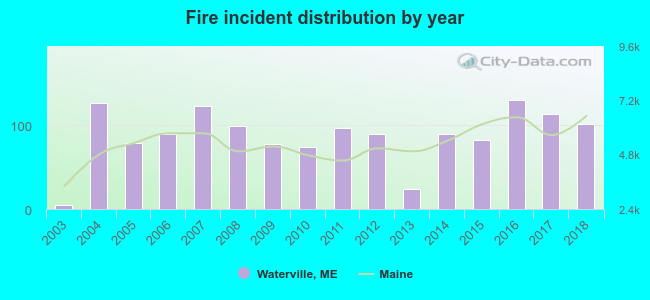 Based on the data from the years 2003 - 2018 the average number of fires per year is 88. The highest number of fire incidents - 130 took place in 2016, and the least - 5 in 2003. The data has a rising trend.
 The median response time based on all reported fire incidents is 5 minutes. This is lower compared to the state median value.
The median response time in Waterville, ME compared to nearest cities:
(Note: Based on data for all years, including only cities with at least 500 fire incidents)
| Waterville: | 5 minutes |
| Oakland: | 5 minutes |
| Skowhegan: | 6 minutes |
| Augusta: | 5 minutes |
| Farmington: | 7 minutes |
 According to the data from the years 2003 - 2018 the average number of fire-related yearly deaths is 0. The highest number of deaths - 2 took place in 2008, and the lowest - 0 in 2003. The data has a constant trend.
 Based on the reports from the years 2003 - 2018 the average number of fire-related yearly casualties is 2. The highest number of casualties - 8 took place in 2008, and the lowest - 0 in 2003. The data has a rising trend.
The average number of injuries per 1,000 fires is 22. This indicator was the highest - 81 in 2008, and the lowest 0 in 2003. The trend for casualties per 1,000 fire incidents is increasing. Compared to the Maine value the number of injuries per 1,000 fire incidents is much higher.
Based on the reports from the years 2003 - 2018 the average number of fire-related yearly casualties is 2. The highest number of casualties - 8 took place in 2008, and the lowest - 0 in 2003. The data has a rising trend.
The average number of injuries per 1,000 fires is 22. This indicator was the highest - 81 in 2008, and the lowest 0 in 2003. The trend for casualties per 1,000 fire incidents is increasing. Compared to the Maine value the number of injuries per 1,000 fire incidents is much higher.Casualties per 1,000 incidents in Waterville, ME compared to nearest cities:
(Note: Based on data for all years, including only cities with at least 500 fire incidents)
| Waterville: | 24.2 |
| Oakland: | 29.5 |
| Skowhegan: | 6.0 |
| Augusta: | 20.4 |
| Farmington: | 1.7 |
 32.8% incidents where reported in the morning and 67.2% in the evening. The most fires (15.4%) took place on Wednesday, and the least (12.7%) on Friday.
 According to the 1,407 incident reports from years 2003 - 2018 most fires (13.3%) took place during May, and the least (5.8%) in August.
 Out of all 16,646 cases reported during the years 2003 - 2018, the most belonged to the categories: Rescue & EMS (64.3%), Hazardous Condition (9.2%), and Fire (8.5%).
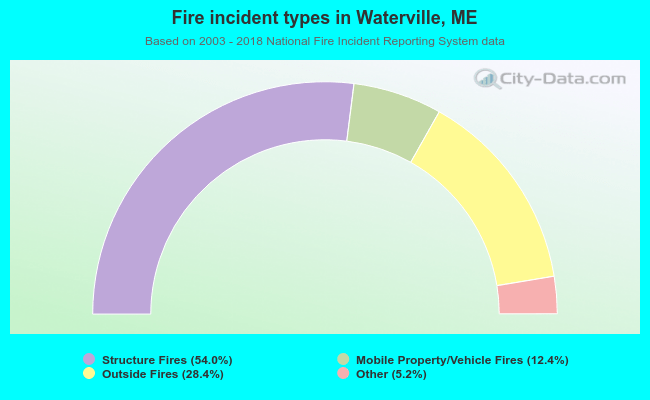 When looking into fire subcategories, the most reports belonged to: Structure Fires (54.0%), and Outside Fires (28.4%).