Wayland: Fire Incidents, Michigan (MI)
Where are fire incidents reported in Wayland, MI
Something went wrong! Please refresh the page.
|
| |||||||||||||||||||||||||||||||||||||||||||||||||||||||||||||||||||||||||||||||||||||||||||||||||||||||||||||
2002 - 2018 National Fire Incident Reporting System (NFIRS) incidents
- Incident types reported to NFIRS in Wayland, MI
- 48727.5%Rescue & EMS
- 46926.5%Fire
- 31017.5%Hazardous Condition
- 25614.4%Good Intent Call
- 1528.6%Service Call
- 653.7%False Alarm
- 130.7%Overpressure Rupture
- 120.7%Special Incident
- 80.5%Severe Weather
- Fire incident types reported to NFIRS in Wayland, MI
- 23249.5%Structure Fires
- 13929.6%Outside Fires
- 6814.5%Mobile Property/Vehicle Fires
- 306.4%Other
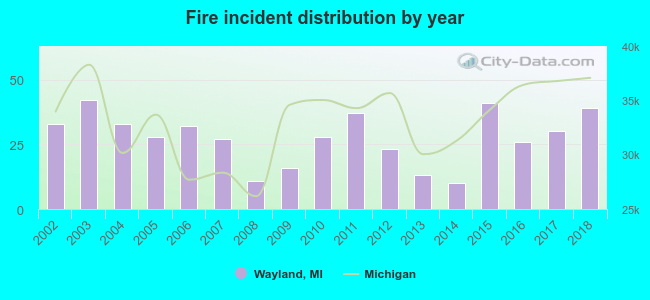 Based on the data from the years 2002 - 2018 the average number of fire incidents per year is 28. The highest number of fire incidents - 42 took place in 2003, and the least - 10 in 2014. The data has an increasing trend.
 35.4% incidents where reported in the morning and 64.6% in the evening. The most fires (16.2%) took place on Saturday, and the least (10.4%) on Thursday.
 Based on the 469 incident reports from years 2002 - 2018 most fires (12.2%) took place during March, and the least (4.9%) in September.
 Out of all 1,772 cases reported during the years 2002 - 2018, the most belonged to the categories: Rescue & EMS (27.5%), Fire (26.5%), and Hazardous Condition (17.5%).
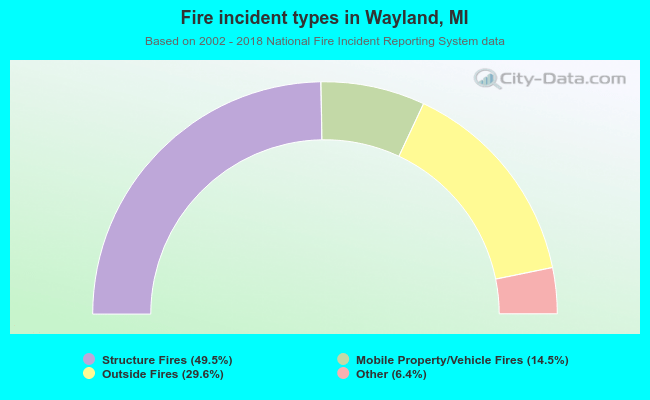 When looking into fire subcategories, the most reports belonged to: Structure Fires (49.5%), and Outside Fires (29.6%).