| Fire incidents reported |
|---|
| Sreet name | Count |
|---|
| BELMONT ST | 14 | | SOUTH ST | 12 | | CARBONDALE RD | 6 | | ELK LAKE DR | 6 | | ROOSEVELT HWY | 6 | | OWEGO TPKE | 4 | | ROBINSON RD | 4 | | SOUTH STREET | 4 | | STANTON RD | 4 | | WARREN RIX DR | 4 | | 0WEGO TPK | 2 | | 1088 OWEGO TURNPIKE | 2 | | 11 WEST ELK FOREST DR | 2 | | 171 BELMONT ST. | 2 | | 233 ROBINSON ROAD | 2 | | 296 RT | 2 | | 370 RT | 2 | | 626 ROOSEVELT HIGHWAY | 2 | | 670 RT | 2 | | BAYLY RD | 2 | | BELMONT TPKE | 2 | | BELMONT TURNPIKE AND BURRIER | 2 | | BUCKLANDS LN | 2 | | CANAAN RD | 2 | | CANNAN ST | 2 |
| | | Fire incidents reported |
|---|
| Sreet name | Count |
|---|
| CHURCH | 2 | | CREEK DRIVE - ROUTE 170 | 2 | | CREEK RD | 2 | | DAVIS RD | 2 | | DAVITT RD | 2 | | EASTON TPK | 2 | | EASTON TPKE | 2 | | ELK LAKE DRIVE | 2 | | FERMOY LN | 2 | | GRAVITY PLANE ROADS | 2 | | GRAVITY STREET | 2 | | HONESDALE RD | 2 | | KEEN LAKE RD | 2 | | LINDE LANE | 2 | | LITTLE KEEN ROAD RD | 2 | | LUMBER DR | 2 | | MADISONVILLE FIRE HOUSE | 2 | | MAIN ST | 2 | | MAPLE ST | 2 | | MERWIN ROAD | 2 | | MERWIN ST | 2 | | NORTH BAKER ROAD | 2 | | OWEGO TRNPK | 2 | | PAZEL RD | 2 | | |
|
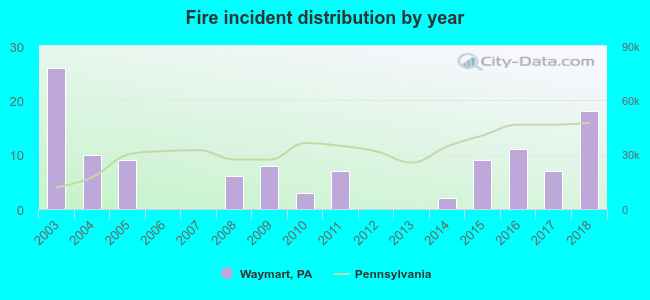 According to the data from the years 2003 - 2018 the average number of fires per year is 7. The highest number of fire incidents - 26 took place in 2003, and the least - 0 in 2006. The data has a declining trend.
 42.2% incidents where reported in the morning and 57.8% in the evening. The most fires (18.1%) took place on Saturday, and the least (10.3%) on Monday.
 According to the 116 reports from years 2003 - 2018 most fires (13.8%) took place during April, and the least (1.7%) in September.
 Out of all 337 cases reported during the years 2003 - 2018, the most belonged to the categories: Fire (34.4%), Rescue & EMS (20.2%), and Overpressure Rupture (17.2%).
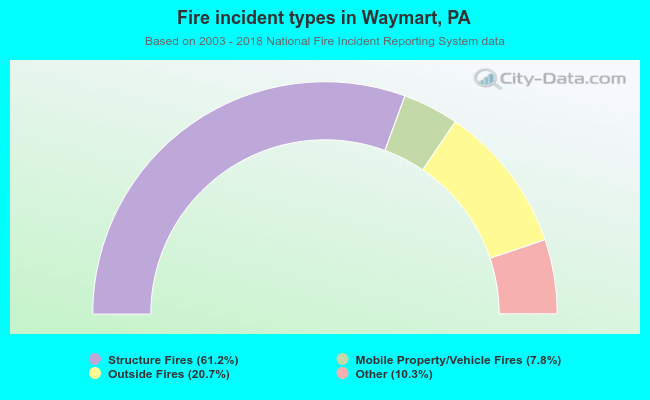 When looking into fire subcategories, the most incidents belonged to: Structure Fires (61.2%), and Outside Fires (20.7%).