Wayzata: Fire Incidents, Minnesota (MN)
Where are fire incidents reported in Wayzata, MN
Something went wrong! Please refresh the page.
|
| |||||||||||||||||||||||||||||||||||||||||||||||||||||||||||||||||||||||||||||||||||||||||||||||||||||||||||||
2002 - 2018 National Fire Incident Reporting System (NFIRS) incidents
- Incident types reported to NFIRS in Wayzata, MN
- 55926.4%Hazardous Condition
- 49023.2%False Alarm
- 35716.9%Good Intent Call
- 35216.6%Fire
- 21510.2%Rescue & EMS
- 1356.4%Service Call
- 30.1%Overpressure Rupture
- 30.1%Severe Weather
- Fire incident types reported to NFIRS in Wayzata, MN
- 21260.2%Structure Fires
- 7120.2%Outside Fires
- 5315.1%Mobile Property/Vehicle Fires
- 164.5%Other
 Based on the data from the years 2002 - 2018 the average number of fires per year is 21. The highest number of reported fires - 36 took place in 2017, and the least - 8 in 2009. The data has a rising trend.
 33.2% incidents where reported in the morning and 66.8% in the evening. The most fires (17.9%) took place on Sunday, and the least (10.8%) on Tuesday.
 Based on the 352 fire incident reports from years 2002 - 2018 most fires (13.4%) took place during June, and the least (5.1%) in January.
 Out of all 2,116 cases reported during the years 2002 - 2018, the most belonged to the categories: Hazardous Condition (26.4%), False Alarm (23.2%), and Good Intent Call (16.9%).
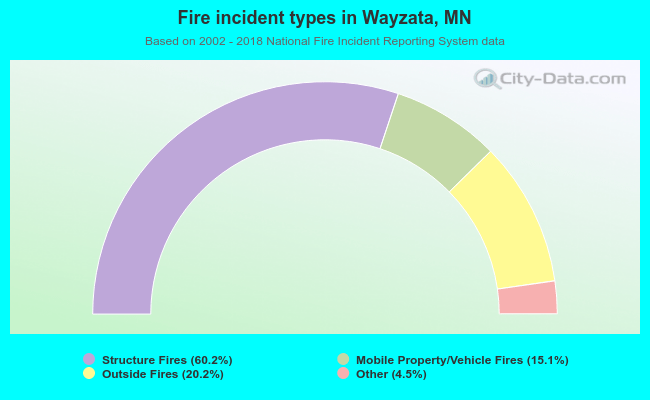 When looking into fire subcategories, the most incidents belonged to: Structure Fires (60.2%), and Outside Fires (20.2%).