| Fire incidents reported |
|---|
| Sreet name | Count |
|---|
| HWY 460 E | 10 | | HWY 1274 | 8 | | 15 OLD MILLSTONE RD | 4 | | 292 LONG RIDGE ROAD | 4 | | 3487 MYERS FORK RD | 4 | | 4432 HWY 746 | 4 | | HWY 1693 | 4 | | HWY 746 | 4 | | OLD STATE ROAD | 4 | | 100 TOBACCO LANE LGTS | 2 | | 102 SAWMILL HILL ROAD | 2 | | 10203 HWY 1274 | 2 | | 1055 WHITE'S BRANCH ROAD | 2 | | 11 HEIDI LANE | 2 | | 1122 IGO RIDGE ROAD | 2 | | 120 TURKEY RIDGE ROAD | 2 | | 1258 BYRD RIDGE RD | 2 | | 1303 ROCKY RD | 2 | | 138 ISSAC DRIVE | 2 | | 1448 OLD STATE ROAD | 2 | | 1469 HWY 2071 | 2 | | 1534 HWY 1693 LGTS | 2 | | 154 KIMBERLY LANE | 2 | | 156 RIDGEWAY DR | 2 | | 158 MURPHY TOWNSEND RD | 2 |
| | | Fire incidents reported |
|---|
| Sreet name | Count |
|---|
| 1684 CUB RUN ROAD | 2 | | 170 HWY 746 | 2 | | 176 PEIRCE RD | 2 | | 177 TURKEY RIDGE ROAD | 2 | | 206 COWBAY LANE | 2 | | 2086 WHITES BRANCH RD LGTS | 2 | | 2095 OLD STATE ROAD | 2 | | 216 CHARLIE INGRAM RD | 2 | | 249 SORRELL ROAD | 2 | | 2531 HWY 1569 LGTS | 2 | | 255 JACKS DRIVE | 2 | | 2640 ARTVILLE ROAD | 2 | | 273 BROWNS RUN ROAD | 2 | | 2733 HIGHWAY 1693 | 2 | | 278 POND CIRCLE | 2 | | 294 HOOSTER RUN ROAD | 2 | | 300 COWBOY LANE | 2 | | 300 COWBOY LN | 2 | | 306 HALLS RIDGE ROAD | 2 | | 32 COON CREEK RD | 2 | | 32 COON CREEK ROAD LGTS | 2 | | 32 EBON ROAD | 2 | | 331 BLEVINS ROAD | 2 | | 3484 HWY 1569 | 2 | | 351 BLEVINS ROAD | 2 |
|
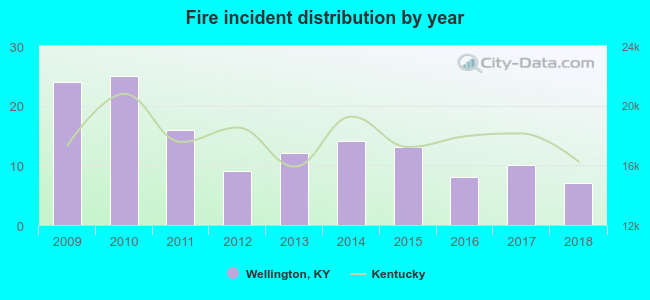 Based on the data from the years 2009 - 2018 the average number of fire incidents per year is 14. The highest number of reported fire incidents - 25 took place in 2010, and the least - 7 in 2018. The data has a declining trend.
 30.4% incidents where reported in the morning and 69.6% in the evening. The most fires (21.0%) took place on Monday, and the least (8.0%) on Tuesday.
 Based on the 138 reports from years 2009 - 2018 most fires (17.4%) took place during April, and the least (3.6%) in August.
 Out of all 304 cases reported during the years 2009 - 2018, the most belonged to the categories: Fire (45.4%), Overpressure Rupture (31.6%), and False Alarm (9.2%).
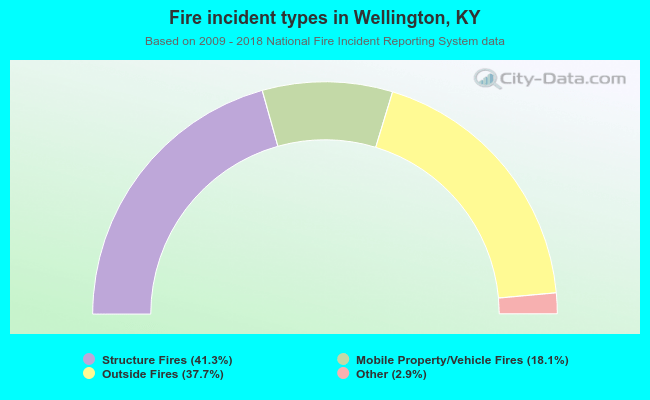 When looking into fire subcategories, the most incidents belonged to: Structure Fires (41.3%), and Outside Fires (37.7%).