| Fire incidents reported |
|---|
| Sreet name | Count |
|---|
| HWY 99 | 8 | | RADIO TOWER RD | 8 | | BRYAN ROAD RD | 6 | | FREELAND ROAD | 6 | | HWY 90 | 6 | | POWERS | 6 | | BOUDREAUX RD | 4 | | I10 EB MP 59 | 4 | | LEBLUE CEM RD | 4 | | MANUEL ROAD RD | 4 | | PINE ISLAND HWY | 4 | | ROSTROM ROAD | 4 | | WILLWOOD | 4 | | 103 HAWTHORNE ST | 2 | | 1209 W MILLARD ST | 2 | | 308 KENNEDY ST | 2 | | 406 POLK | 2 | | 518 RUSSELL ST | 2 | | 5TH ST AT WEST NORTH ST | 2 | | 609 DAUTEL ST | 2 | | 901 STOP | 2 | | ABELL AND LEBLANC RD | 2 | | ADAMS ST | 2 | | ARMSTRONG ST | 2 | | BEAUFORD ST | 2 |
| | | Fire incidents reported |
|---|
| Sreet name | Count |
|---|
| BEAUFORT | 2 | | BELLARD RD | 2 | | BETHANE PARK | 2 | | BLANCHARD RD | 2 | | BLANCHARD RD | 2 | | BOURGEOIS ST | 2 | | BRYAN RD | 2 | | COOPER | 2 | | DAUTEL ST | 2 | | DAVID RD | 2 | | DONALD RD | 2 | | DUREOUN ST | 2 | | FREELAND RD | 2 | | FREY RD | 2 | | HIGHWAY 395 | 2 | | HIGHWAY 90 | 2 | | HIGHWAY 99 | 2 | | HIGHWAY 99 HWY | 2 | | HWY 102 | 2 | | HWY 3086 | 2 | | I10 WB MP 56 | 2 | | INTERSTATE 10 FWY | 2 | | JARRETT ST | 2 | | JOHNNY BENOIT RD | 2 | | |
|
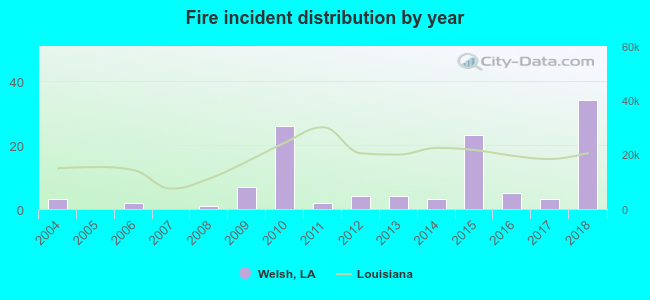 According to the data from the years 2004 - 2018 the average number of fire incidents per year is 8. The highest number of reported fire incidents - 34 took place in 2018, and the least - 0 in 2005. The data has a growing trend.
 41.0% incidents where reported in the morning and 59.0% in the evening. The most fires (21.4%) took place on Monday, and the least (7.7%) on Sunday.
 Based on the 117 fire incident reports from years 2004 - 2018 most fires (14.5%) took place during June, and the least (3.4%) in February.
 Out of all 213 cases reported during the years 2004 - 2018, the most belonged to the categories: Fire (54.9%), Rescue & EMS (15.5%), and Overpressure Rupture (12.7%).
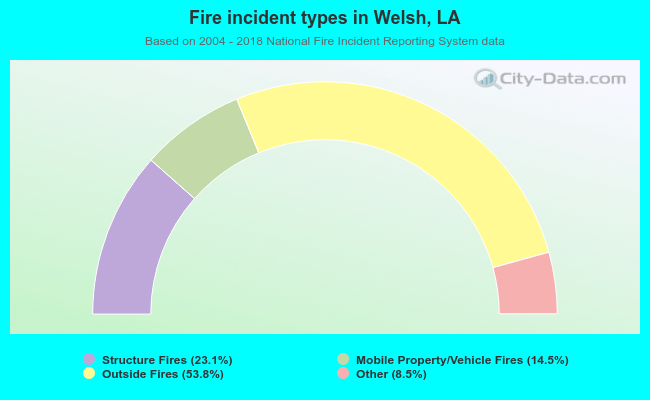 When looking into fire subcategories, the most incidents belonged to: Outside Fires (53.8%), and Structure Fires (23.1%).