West Lebanon: Fire Incidents, Indiana (IN)
Where are fire incidents reported in West Lebanon, IN
Something went wrong! Please refresh the page.
|
| |||||||||||||||||||||||||||||||||||||||||||||||||||||||||||||||||||||||||||||||||||||||||||||||||||||||||||||
| Other | 48 | |||||||||||||||||||||||||||||||||||||||||||||||||||||||||||||||||||||||||||||||||||||||||||||||||||||||||||||
2002 - 2017 National Fire Incident Reporting System (NFIRS) incidents
- Incident types reported to NFIRS in West Lebanon, IN
- 20472.3%Fire
- 3412.1%Rescue & EMS
- 3010.6%Hazardous Condition
- 82.8%Good Intent Call
- 31.1%Service Call
- 10.4%False Alarm
- 10.4%Severe Weather
- 10.4%Special Incident
- Fire incident types reported to NFIRS in West Lebanon, IN
- 8843.1%Structure Fires
- 8441.2%Outside Fires
- 2713.2%Mobile Property/Vehicle Fires
- 52.5%Other
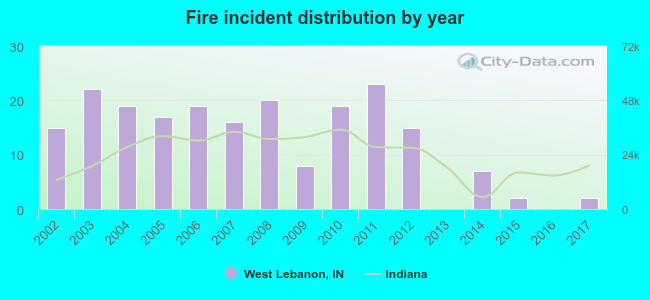 Based on the data from the years 2002 - 2017 the average number of fires per year is 13. The highest number of fires - 23 took place in 2011, and the least - 0 in 2013. The data has a declining trend.
 31.9% incidents where reported in the morning and 68.1% in the evening. The most fires (23.0%) took place on Monday, and the least (11.3%) on Tuesday.
 Based on the 204 incident reports from years 2002 - 2017 most fires (19.1%) took place during April, and the least (3.4%) in October.
 Out of all 282 cases reported during the years 2002 - 2017, the most belonged to the categories: Fire (72.3%), Overpressure Rupture (12.1%), and Rescue & EMS (10.6%).
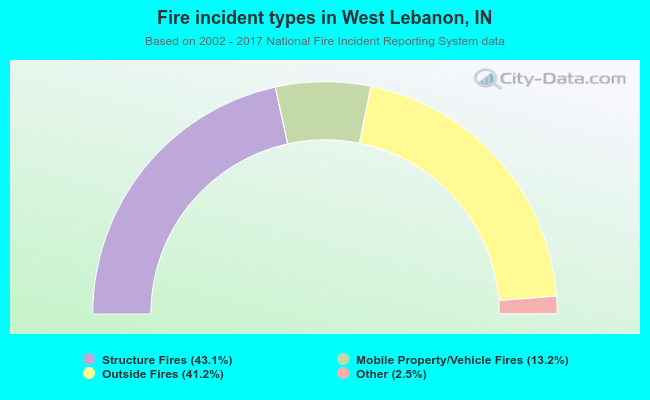 When looking into fire subcategories, the most incidents belonged to: Structure Fires (43.1%), and Outside Fires (41.2%).