West Milford: Fire Incidents, New Jersey (NJ)
Where are fire incidents reported in West Milford, NJ
Something went wrong! Please refresh the page.
| Fire incidents reported | |
|---|---|
| Sreet name | Count |
| MACOPIN RD | 138 |
| RICHMOND RD | 94 |
| RT 23 HWY | 84 |
| UNION VALLEY RD | 84 |
| MAPLE RD | 50 |
| MORSETOWN RD | 44 |
| OAK RIDGE RD | 44 |
| HIGHLANDER DR | 40 |
| MARSHALL HILL (TO 140) RD | 40 |
| WESTBROOK RD | 40 |
| CAHILL CROSS RD | 38 |
| GREENWOOD LAKE TPKE | 38 |
| LAKESHORE DR | 38 |
| UNION VALLEY TO 1698 RD | 36 |
| GERMANTOWN RD | 32 |
| HIGH CREST DR | 32 |
| OTTERHOLE RD | 32 |
| RIDGE RD | 32 |
| BEARFORT RD | 26 |
| LAKESIDE RD | 26 |
| LYCOSKYMARHILL DR | 24 |
| GREENDALE DR | 22 |
| OTTERHOLE RD RD | 22 |
| RT 23 NORTH HWY | 22 |
| SCHOFIELD RD | 22 |
| POST BROOK | 20 |
| SETTING SUN TRL | 20 |
| VINE ST | 20 |
| WEAVER RD | 20 |
| LINCOLN AVE | 18 |
| Other | 306 |
2004 - 2018 National Fire Incident Reporting System (NFIRS) incidents
- Incident types reported to NFIRS in West Milford, NJ
- 1,50433.3%Fire
- 1,45332.2%Hazardous Condition
- 77917.2%False Alarm
- 46910.4%Good Intent Call
- 2255.0%Service Call
- 691.5%Rescue & EMS
- 130.3%Overpressure Rupture
- Fire incident types reported to NFIRS in West Milford, NJ
- 87758.3%Structure Fires
- 38425.5%Outside Fires
- 16511.0%Mobile Property/Vehicle Fires
- 785.2%Other
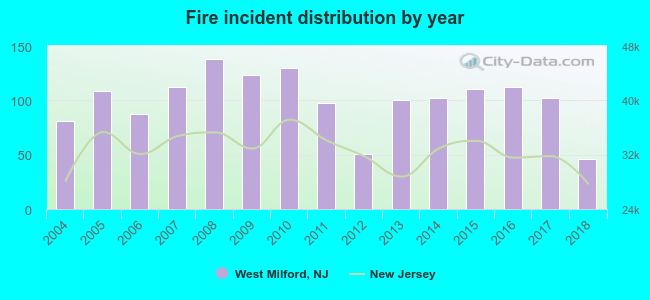 Based on the data from the years 2004 - 2018 the average number of fire incidents per year is 100. The highest number of fire incidents - 138 took place in 2008, and the least - 46 in 2018. The data has a declining trend.
The average number of yearly fire incidents per 10k residents in West Milford, NJ compared to nearest cities:
(Note: Based on data for the last 3 years, including only cities with population 5,000 and above)
| West Milford: | 33.1 |
| Ringwood: | 59.8 |
| Wanaque: | 16.9 |
| Bloomingdale: | 25.3 |
| Butler: | 16.5 |
| Kinnelon: | 32.8 |
| Pompton Lakes: | 14.9 |
| Oakland: | 19.9 |
| Franklin Lakes: | 20.3 |
 The median response time based on all reported fire incidents is 6 minutes. This is close to the state median value.
The median response time in West Milford, NJ compared to nearest cities:
(Note: Based on data for all years, including only cities with at least 500 fire incidents)
| West Milford: | 6 minutes |
| Ringwood: | 3 minutes |
| Kinnelon: | 5 minutes |
| Oakland: | 5 minutes |
| Ramsey: | 7 minutes |
| Wyckoff: | 5 minutes |
| Wayne: | 5 minutes |
| Hawthorne: | 5 minutes |
| Rockaway: | 8 minutes |
 29.9% incidents where reported in the morning and 70.1% in the evening. The most fires (16.3%) took place on Saturday, and the least (12.6%) on Thursday.
 According to the 1,504 fires from years 2004 - 2018 most fires (12.8%) took place during April, and the least (5.6%) in October.
 Out of all 4,519 cases reported during the years 2004 - 2018, the most belonged to the categories: Fire (33.3%), Hazardous Condition (32.2%), and False Alarm (17.2%).
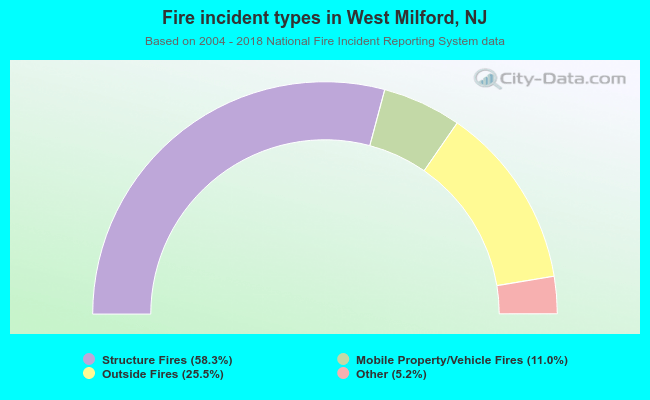 When looking into fire subcategories, the most reports belonged to: Structure Fires (58.3%), and Outside Fires (25.5%).