West Newbury: Fire Incidents, Massachusetts (MA)
Where are fire incidents reported in West Newbury, MA
Something went wrong! Please refresh the page.
|
| |||||||||||||||||||||||||||||||||||||||||||||||||||||||||||||||||||||||||||||||||||||||||||||||||||||||||||||
2003 - 2018 National Fire Incident Reporting System (NFIRS) incidents
- Incident types reported to NFIRS in West Newbury, MA
- 94444.4%Rescue & EMS
- 40519.1%Service Call
- 26712.6%False Alarm
- 1637.7%Good Intent Call
- 1617.6%Hazardous Condition
- 1507.1%Fire
- 341.6%Severe Weather
- Fire incident types reported to NFIRS in West Newbury, MA
- 8959.3%Structure Fires
- 4228.0%Outside Fires
- 1510.0%Mobile Property/Vehicle Fires
- 42.7%Other
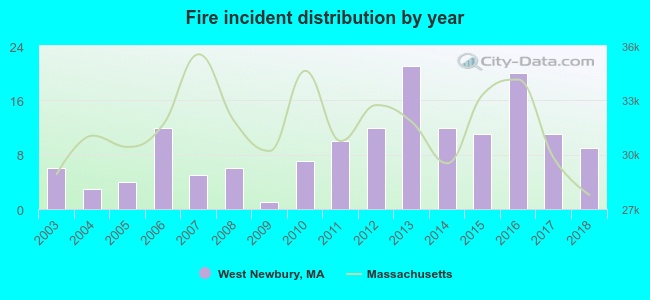 According to the data from the years 2003 - 2018 the average number of fire incidents per year is 9. The highest number of reported fire incidents - 21 took place in 2013, and the least - 1 in 2009. The data has a rising trend.
 Based on the reports from the years 2003 - 2018 the average number of fire-related casualties per year is 1. The highest number of injuries - 2 took place in 2011, and the lowest - 0 in 2004. The data has a growing trend.
 35.3% incidents where reported in the morning and 64.7% in the evening. The most fires (20.7%) took place on Monday, and the least (10.7%) on Sunday.
 Based on the 150 fire incidents from years 2003 - 2018 most fires (14.0%) took place during January, and the least (2.7%) in June.
 Out of all 2,124 cases reported during the years 2003 - 2018, the most belonged to the categories: Overpressure Rupture (44.4%), Hazardous Condition (19.1%), and Good Intent Call (12.6%).
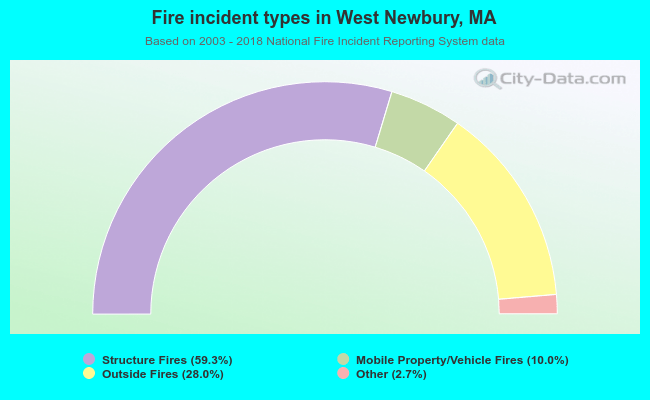 When looking into fire subcategories, the most reports belonged to: Structure Fires (59.3%), and Outside Fires (28.0%).