West Rutland: Fire Incidents, Vermont (VT)
Where are fire incidents reported in West Rutland, VT
Something went wrong! Please refresh the page.
|
| |||||||||||||||||||||||||||||||||||||||||||||||||||||||||||||||||||||||||||||||||||||||||||||||||||||||||||||
2002 - 2018 National Fire Incident Reporting System (NFIRS) incidents
- Incident types reported to NFIRS in West Rutland, VT
- 27743.1%Hazardous Condition
- 17827.7%Fire
- 6810.6%Service Call
- 467.2%Rescue & EMS
- 457.0%False Alarm
- 284.4%Good Intent Call
- 10.2%Special Incident
- Fire incident types reported to NFIRS in West Rutland, VT
- 7341.0%Structure Fires
- 6134.3%Outside Fires
- 3620.2%Mobile Property/Vehicle Fires
- 84.5%Other
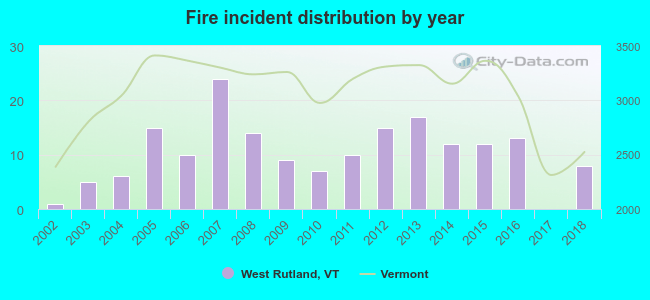 According to the data from the years 2002 - 2018 the average number of fires per year is 10. The highest number of fire incidents - 24 took place in 2007, and the least - 0 in 2017. The data has a growing trend.
 28.7% incidents where reported in the morning and 71.3% in the evening. The most fires (19.7%) took place on Thursday, and the least (11.2%) on Monday.
 Based on the 178 fire incident reports from years 2002 - 2018 most fires (21.3%) took place during April, and the least (2.2%) in December.
 Out of all 643 cases reported during the years 2002 - 2018, the most belonged to the categories: Rescue & EMS (43.1%), Fire (27.7%), and Hazardous Condition (10.6%).
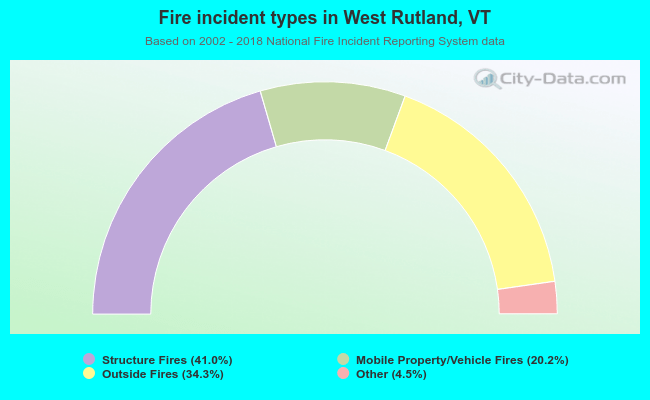 When looking into fire subcategories, the most incidents belonged to: Structure Fires (41.0%), and Outside Fires (34.3%).