West Warwick: Fire Incidents, Rhode Island (RI)
Where are fire incidents reported in West Warwick, RI
Something went wrong! Please refresh the page.
| Fire incidents reported | |
|---|---|
| Sreet name | Count |
| MAIN ST | 228 |
| PROVIDENCE ST | 116 |
| MAIN STREET | 70 |
| PROVIDENCE STREET | 64 |
| GOUGH AVE | 60 |
| GOUGH AVENUE | 56 |
| COWESETT AVE | 50 |
| WASHINGTON ST | 46 |
| MAPLE AVE | 32 |
| BROOKSIDE AVE | 30 |
| ARCHAMBAULT AVE | 26 |
| TANGLEWOOD CT | 24 |
| PULASKI ST | 18 |
| WAKEFIELD ST | 18 |
| ROBERT ST | 16 |
| TIOGUE AVE | 16 |
| ANDREWS AVE | 14 |
| WAKEFIELD STREET | 14 |
| CURSON ST | 12 |
| DIVISION ROAD | 12 |
| EAST MAIN ST | 12 |
| LEGRIS AVE | 12 |
| OLD CARRAIGE RD | 12 |
| REVERE AVE | 12 |
| TANGLEWOOD COURT | 12 |
| WEAVER ST | 12 |
| WEST WARWICK AVE | 12 |
| ANDREWS AVENUE | 10 |
| DIVISION RD | 10 |
| EARL ST | 10 |
2009 - 2018 National Fire Incident Reporting System (NFIRS) incidents
- Incident types reported to NFIRS in West Warwick, RI
- 4,95557.7%Rescue & EMS
- 1,00011.6%Fire
- 8309.7%False Alarm
- 8029.3%Hazardous Condition
- 6027.0%Service Call
- 3524.1%Good Intent Call
- 230.3%Severe Weather
- 170.2%Special Incident
- 130.2%Overpressure Rupture
- Fire incident types reported to NFIRS in West Warwick, RI
- 68668.6%Structure Fires
- 25425.4%Outside Fires
- 454.5%Mobile Property/Vehicle Fires
- 151.5%Other
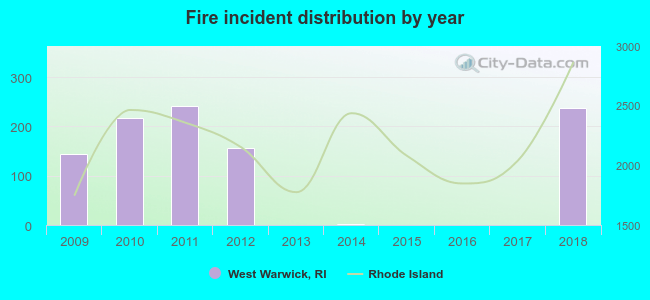 According to the data from the years 2009 - 2018 the average number of fire incidents per year is 100. The highest number of fire incidents - 242 took place in 2011, and the least - 0 in 2015. The data has a growing trend.
The average number of yearly fire incidents per 10k residents in West Warwick, RI compared to nearest cities:
(Note: Based on data for the last 3 years, including only cities with population 5,000 and above)
| West Warwick: | 79.6 |
| Coventry: | 21.0 |
| East Greenwich: | 23.6 |
| Warwick: | 0.3 |
| Cranston: | 25.6 |
| Scituate: | 3.9 |
| Johnston: | 26.6 |
| West Greenwich: | 62.5 |
| North Kingstown: | 5.3 |
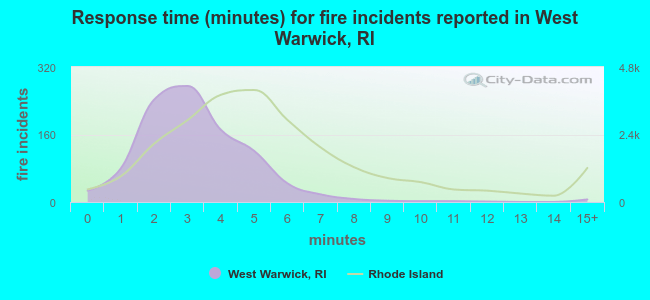 The median response time based on all reported fire incidents is 3 minutes. This is lower than the Rhode Island median value.
The median response time in West Warwick, RI compared to nearest cities:
(Note: Based on data for all years, including only cities with at least 500 fire incidents)
| West Warwick: | 3 minutes |
| Coventry: | 7 minutes |
| Warwick: | 4 minutes |
| Cranston: | 4 minutes |
| Providence: | 5 minutes |
| East Providence: | 5 minutes |
| North Providence: | 4 minutes |
| Smithfield: | 6 minutes |
| Bristol: | 6 minutes |
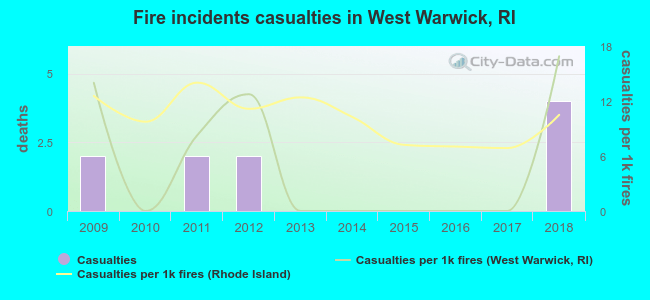 Based on the data from the years 2009 - 2018 the average number of fire-related casualties per year is 1. The highest number of casualties - 4 took place in 2018, and the lowest - 0 in 2010. The data has a rising trend.
The average number of casualties per 1,000 fire incidents is 5. This indicator was the highest - 17 in 2018, and the lowest 0 in 2010. The trend for injuries per 1,000 fires is increasing. Compared to the Rhode Island value the number of injuries per 1,000 fires is similar.
Based on the data from the years 2009 - 2018 the average number of fire-related casualties per year is 1. The highest number of casualties - 4 took place in 2018, and the lowest - 0 in 2010. The data has a rising trend.
The average number of casualties per 1,000 fire incidents is 5. This indicator was the highest - 17 in 2018, and the lowest 0 in 2010. The trend for injuries per 1,000 fires is increasing. Compared to the Rhode Island value the number of injuries per 1,000 fires is similar.Casualties per 1,000 incidents in West Warwick, RI compared to nearest cities:
(Note: Based on data for all years, including only cities with at least 500 fire incidents)
| West Warwick: | 10.0 |
| Coventry: | 0.0 |
| Warwick: | 2.8 |
| Cranston: | 16.0 |
| Providence: | 0.7 |
| East Providence: | 44.7 |
| North Providence: | 10.6 |
| Smithfield: | 6.1 |
| Bristol: | 7.9 |
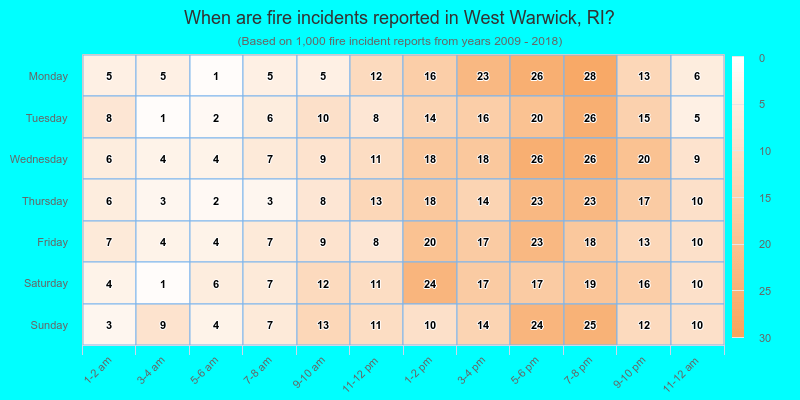
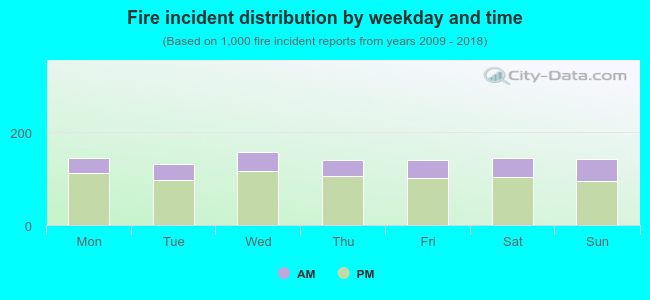 27.1% incidents where reported in the morning and 72.9% in the evening. The most fires (15.8%) took place on Wednesday, and the least (13.1%) on Tuesday.
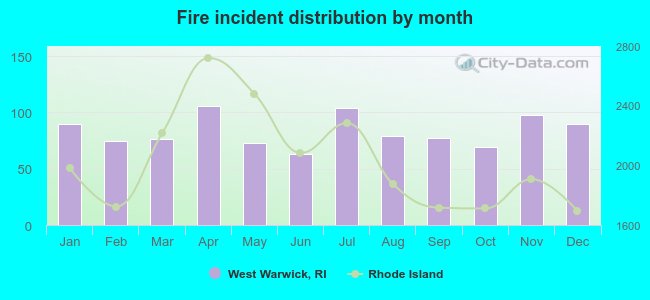 According to the 1,000 fires from years 2009 - 2018 most fires (10.6%) took place during April, and the least (6.3%) in June.
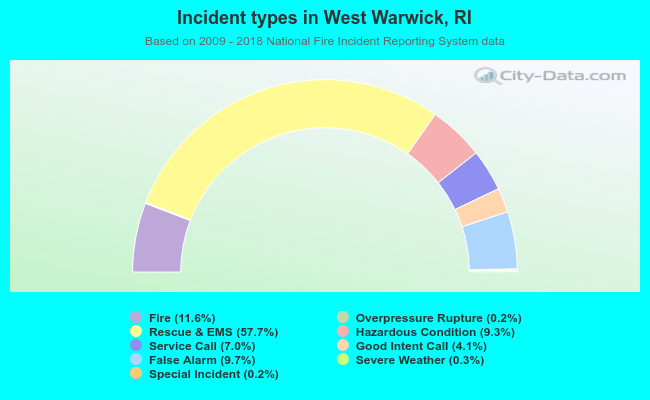 Out of all 8,594 cases reported during the years 2009 - 2018, the most belonged to the categories: Rescue & EMS (57.7%), Fire (11.6%), and False Alarm (9.7%).
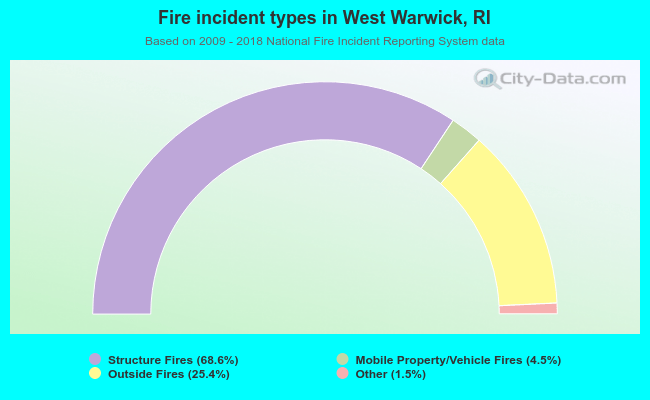 When looking into fire subcategories, the most reports belonged to: Structure Fires (68.6%), and Outside Fires (25.4%).