Whitsett: Fire Incidents, North Carolina (NC)
Where are fire incidents reported in Whitsett, NC
Something went wrong! Please refresh the page.
|
| |||||||||||||||||||||||||||||||||||||||||||||||||||||||||||||||||||||||||||||||||||||||||||||||||||||||||||||
2002 - 2018 National Fire Incident Reporting System (NFIRS) incidents
- Incident types reported to NFIRS in Whitsett, NC
- 1,44435.9%Rescue & EMS
- 95823.8%Good Intent Call
- 68116.9%Fire
- 41210.3%False Alarm
- 2817.0%Hazardous Condition
- 2305.7%Service Call
- 70.2%Overpressure Rupture
- Fire incident types reported to NFIRS in Whitsett, NC
- 33148.6%Structure Fires
- 20830.5%Outside Fires
- 12518.4%Mobile Property/Vehicle Fires
- 172.5%Other
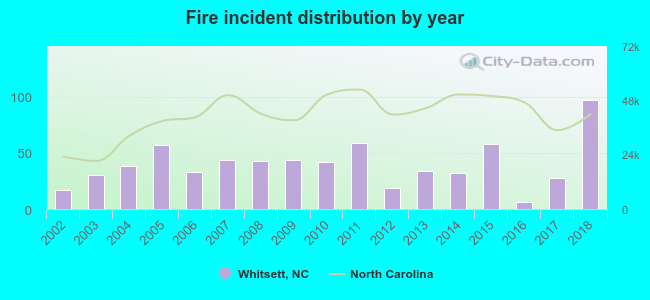 Based on the data from the years 2002 - 2018 the average number of fires per year is 40. The highest number of fire incidents - 97 took place in 2018, and the least - 6 in 2016. The data has a growing trend.
 The median response time based on all reported fire incidents is 6 minutes. This is close to the state median value.
The median response time in Whitsett, NC compared to nearest cities:
(Note: Based on data for all years, including only cities with at least 500 fire incidents)
| Whitsett: | 6 minutes |
| Gibsonville: | 5 minutes |
| Elon: | 6 minutes |
| McLeansville: | 6 minutes |
| Burlington: | 5 minutes |
| Graham: | 6 minutes |
| Pleasant Garden: | 6 minutes |
| Greensboro: | 4 minutes |
| Liberty: | 8 minutes |
 30.5% incidents where reported in the morning and 69.5% in the evening. The most fires (16.9%) took place on Saturday, and the least (12.5%) on Wednesday.
 According to the 681 reports from years 2002 - 2018 most fires (12.6%) took place during January, and the least (5.3%) in May.
 Out of all 4,018 cases reported during the years 2002 - 2018, the most belonged to the categories: Rescue & EMS (35.9%), Good Intent Call (23.8%), and Fire (16.9%).
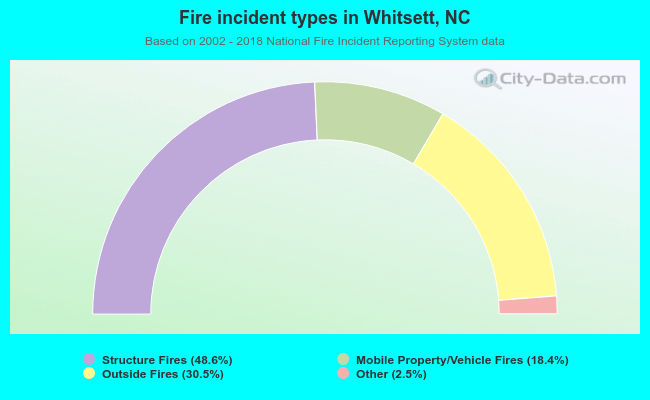 When looking into fire subcategories, the most reports belonged to: Structure Fires (48.6%), and Outside Fires (30.5%).