| Fire incidents reported |
|---|
| Sreet name | Count |
|---|
| 270 HWY | 32 | | HWY 270 HWY | 16 | | HWY. 270 HWY | 16 | | 2 HWY | 14 | | HIGHBRIDGE RD | 14 | | CENTER POINT RD | 12 | | HIGHBRIDGE RD RD | 12 | | CRAVENS RD | 8 | | HIGHBRIDGE RD. RD | 8 | | HWY 2 N. | 8 | | 21 MINE RD | 6 | | ASH CREEK RD | 6 | | BOWERS RD RD | 6 | | BOWERS RD. RD | 6 | | DAMON VALLEY | 6 | | FOSTER RD. RD | 6 | | HULSEY PRARIE RD. | 6 | | HWY 2 NORTH | 6 | | MAIN ST | 6 | | SO. OFF BOWERS RD. RD | 6 | | TUCKER KNOB RD | 6 | | 2 | 4 | | 7TH ST | 4 | | ADA | 4 | | BATTLES RD. RD | 4 |
| | | Fire incidents reported |
|---|
| Sreet name | Count |
|---|
| BLAIR | 4 | | BLAIR AVE | 4 | | CLONSCILLA HILL RD. RD | 4 | | CRAVENS RD | 4 | | DEGMAN RD | 4 | | DEGNAN RD | 4 | | DON MCCLAIN RD. RD | 4 | | HOUSTON CIRCLE | 4 | | HULSEY PRAIRE RD | 4 | | HWY 2 | 4 | | HWY 2 HWY | 4 | | HWY 270 WEST | 4 | | LIMESTONE RD | 4 | | LIMESTONE RD. RD | 4 | | LUTIE RD | 4 | | MAIN | 4 | | MOUNTAIN STA. RD. RD | 4 | | PATTERSON RD RD | 4 | | SW CRAVENS RD | 4 | | WEST ASH | 4 | | #2 HIGHWAY HWY | 2 | | #2 HWY. HWY | 2 | | 1 HWY | 2 | | 1/2 MILE EAST OF STA | 2 | | |
|
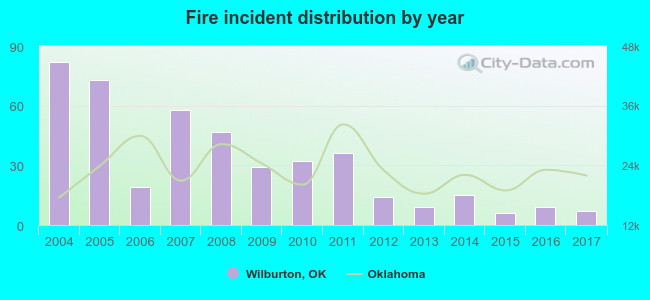 Based on the data from the years 2004 - 2017 the average number of fire incidents per year is 31. The highest number of reported fire incidents - 82 took place in 2004, and the least - 6 in 2015. The data has a declining trend.
 31.0% incidents where reported in the morning and 69.0% in the evening. The most fires (15.8%) took place on Saturday, and the least (12.4%) on Monday.
 According to the 436 reports from years 2004 - 2017 most fires (19.3%) took place during March, and the least (2.5%) in May.
 Out of all 546 cases reported during the years 2004 - 2017, the most belonged to the categories: Fire (79.9%), Rescue & EMS (11.0%), and Service Call (4.9%).
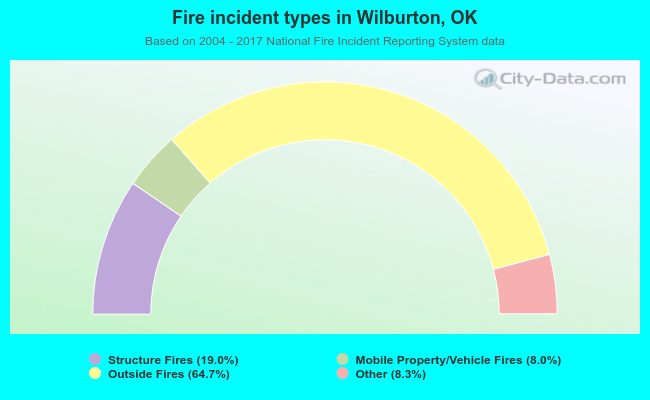 When looking into fire subcategories, the most reports belonged to: Outside Fires (64.7%), and Structure Fires (19.0%).