Wilkinsburg: Fire Incidents, Pennsylvania (PA)
Where are fire incidents reported in Wilkinsburg, PA
Something went wrong! Please refresh the page.
|
| |||||||||||||||||||||||||||||||||||||||||||||||||||||||||||||||||||||||||||||||||||||||||||||||||||||||||||||
2004 - 2018 National Fire Incident Reporting System (NFIRS) incidents
- Incident types reported to NFIRS in Wilkinsburg, PA
- 32127.4%Hazardous Condition
- 24420.8%False Alarm
- 16914.4%Rescue & EMS
- 16213.8%Fire
- 13711.7%Good Intent Call
- 12911.0%Service Call
- 70.6%Overpressure Rupture
- 20.2%Special Incident
- Fire incident types reported to NFIRS in Wilkinsburg, PA
- 9860.5%Structure Fires
- 3823.5%Outside Fires
- 2314.2%Mobile Property/Vehicle Fires
- 31.9%Other
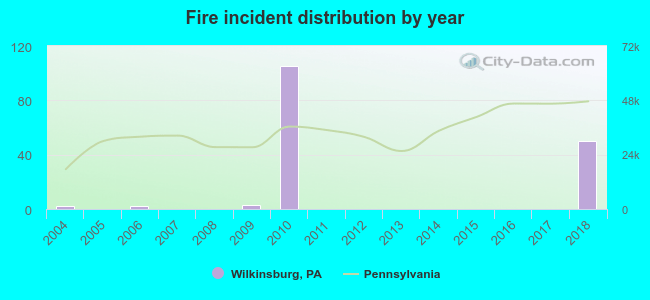 According to the data from the years 2004 - 2018 the average number of fire incidents per year is 11. The highest number of fires - 105 took place in 2010, and the least - 0 in 2005. The data has a growing trend.
The average number of yearly fire incidents per 10k residents in Wilkinsburg, PA compared to nearest cities:
(Note: Based on data for the last 3 years, including only cities with population 5,000 and above)
| Wilkinsburg: | 31.6 |
| Swissvale: | 58.0 |
| Forest Hills: | 31.9 |
| Penn Hills: | 18.7 |
| Turtle Creek: | 43.4 |
| Munhall: | 46.6 |
| Fox Chapel: | 10.5 |
| Monroeville: | 27.7 |
| Pittsburgh: | 25.4 |
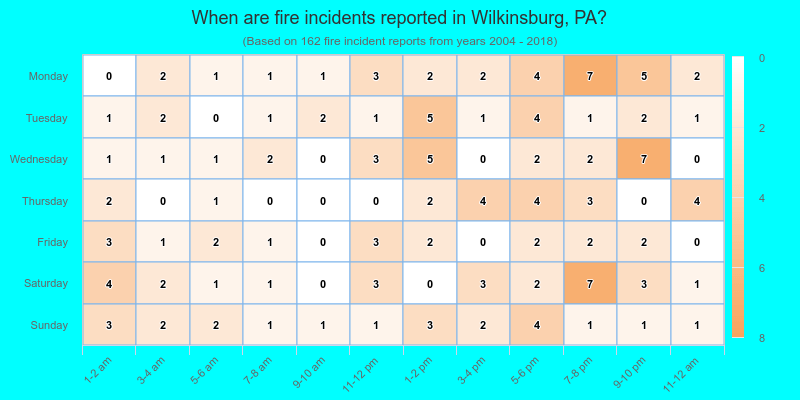
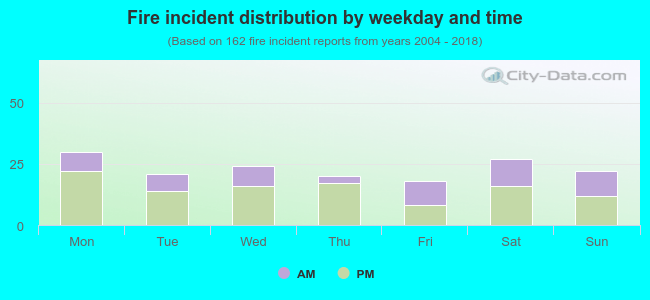 35.2% incidents where reported in the morning and 64.8% in the evening. The most fires (18.5%) took place on Monday, and the least (11.1%) on Friday.
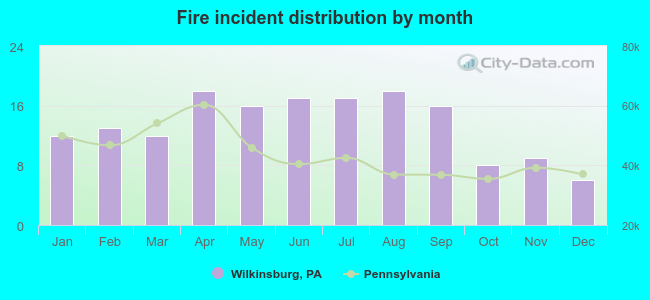 Based on the 162 fire incidents from years 2004 - 2018 most fires (11.1%) took place during April, and the least (3.7%) in December.
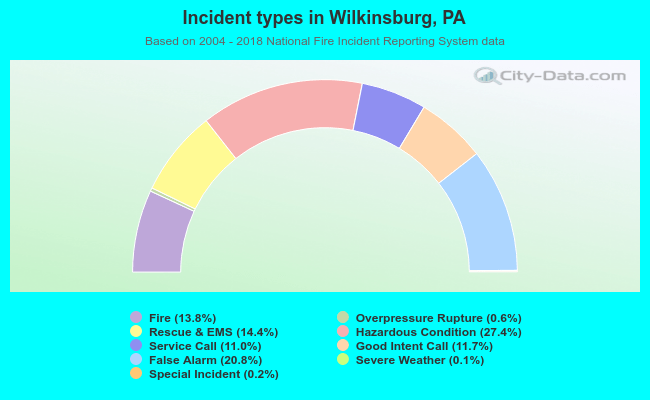 Out of all 1,172 cases reported during the years 2004 - 2018, the most belonged to the categories: Hazardous Condition (27.4%), False Alarm (20.8%), and Rescue & EMS (14.4%).
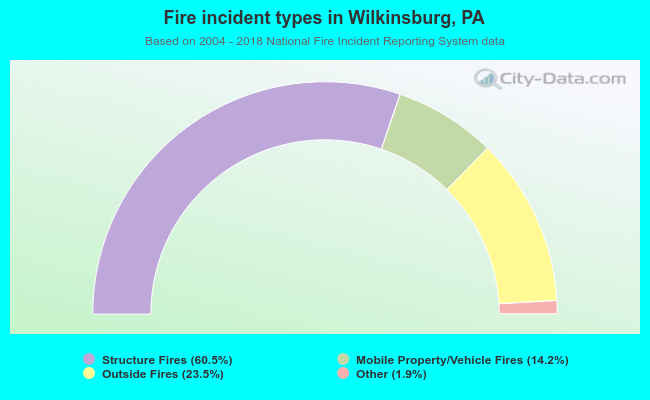 When looking into fire subcategories, the most reports belonged to: Structure Fires (60.5%), and Outside Fires (23.5%).