Williamsburg: Fire Incidents, Massachusetts (MA)
Where are fire incidents reported in Williamsburg, MA
Something went wrong! Please refresh the page.
|
| |||||||||||||||||||||||||||||||||||||||||||||||||||||||||||||||||||||||||||||||||||||||||
2002 - 2018 National Fire Incident Reporting System (NFIRS) incidents
- Incident types reported to NFIRS in Williamsburg, MA
- 55351.3%Rescue & EMS
- 16715.5%Hazardous Condition
- 13412.4%Fire
- 999.2%False Alarm
- 565.2%Service Call
- 454.2%Good Intent Call
- 161.5%Special Incident
- 40.4%Severe Weather
- 30.3%Overpressure Rupture
- Fire incident types reported to NFIRS in Williamsburg, MA
- 7959.0%Structure Fires
- 3022.4%Outside Fires
- 1511.2%Other
- 107.5%Mobile Property/Vehicle Fires
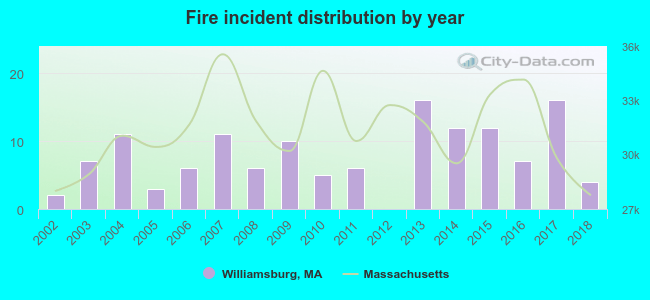 Based on the data from the years 2002 - 2018 the average number of fire incidents per year is 8. The highest number of reported fire incidents - 16 took place in 2013, and the least - 0 in 2012. The data has a rising trend.
 Based on the reports from the years 2002 - 2018 the average number of fire-related casualties per year is 0. The highest number of injuries - 1 took place in 2007, and the lowest - 0 in 2002. The data has a constant trend.
 42.5% incidents where reported in the morning and 57.5% in the evening. The most fires (21.6%) took place on Saturday, and the least (7.5%) on Sunday.
 Based on the 134 fires from years 2002 - 2018 most fires (19.4%) took place during April, and the least (2.2%) in June.
 Out of all 1,077 cases reported during the years 2002 - 2018, the most belonged to the categories: Rescue & EMS (51.3%), Hazardous Condition (15.5%), and Fire (12.4%).
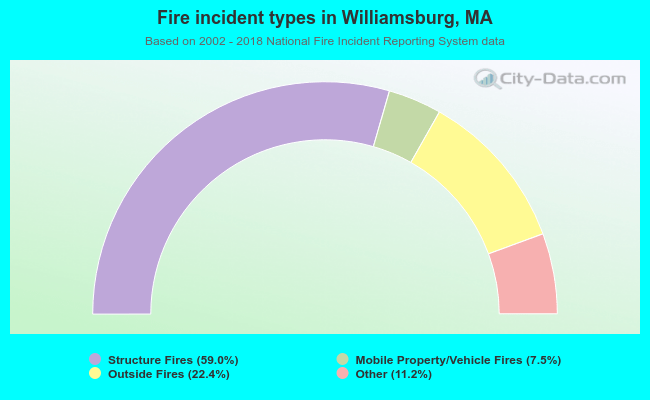 When looking into fire subcategories, the most incidents belonged to: Structure Fires (59.0%), and Outside Fires (22.4%).