Winnsboro: Fire Incidents, Louisiana (LA)
Where are fire incidents reported in Winnsboro, LA
Something went wrong! Please refresh the page.
|
| |||||||||||||||||||||||||||||||||||||||||||||||||||||||||||||||||||||||||||||||||||||||||||||||||||||||||||||
| Other | 263 | |||||||||||||||||||||||||||||||||||||||||||||||||||||||||||||||||||||||||||||||||||||||||||||||||||||||||||||
2002 - 2018 National Fire Incident Reporting System (NFIRS) incidents
- Incident types reported to NFIRS in Winnsboro, LA
- 54978.3%Fire
- 517.3%False Alarm
- 365.1%Service Call
- 253.6%Hazardous Condition
- 253.6%Good Intent Call
- 142.0%Rescue & EMS
- 10.1%Special Incident
- Fire incident types reported to NFIRS in Winnsboro, LA
- 28451.7%Outside Fires
- 20337.0%Structure Fires
- 458.2%Mobile Property/Vehicle Fires
- 173.1%Other
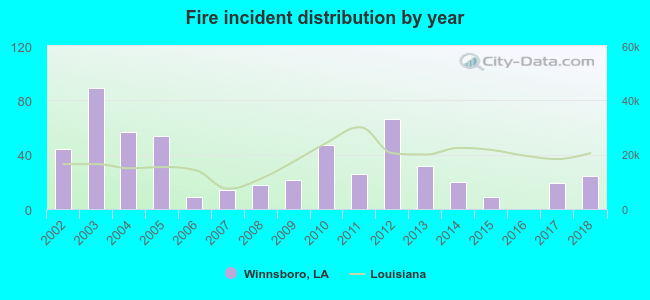 According to the data from the years 2002 - 2018 the average number of fire incidents per year is 32. The highest number of reported fires - 89 took place in 2003, and the least - 0 in 2016. The data has a dropping trend.
 The median response time based on all reported fire incidents is 6 minutes. This is similar to the Louisiana median value.
The median response time in Winnsboro, LA compared to nearest cities:
(Note: Based on data for all years, including only cities with at least 500 fire incidents)
| Winnsboro: | 6 minutes |
| Rayville: | 5 minutes |
| Delhi: | 8 minutes |
| Monroe: | 5 minutes |
| West Monroe: | 6 minutes |
| Tallulah: | 4 minutes |
| Jena: | 5 minutes |
| Bastrop: | 4 minutes |
| Calhoun: | 7 minutes |
 41.9% incidents where reported in the morning and 58.1% in the evening. The most fires (16.9%) took place on Thursday, and the least (12.2%) on Friday.
 Based on the 549 reports from years 2002 - 2018 most fires (11.5%) took place during September, and the least (4.2%) in April.
 Out of all 701 cases reported during the years 2002 - 2018, the most belonged to the categories: Fire (78.3%), Good Intent Call (7.3%), and Hazardous Condition (5.1%).
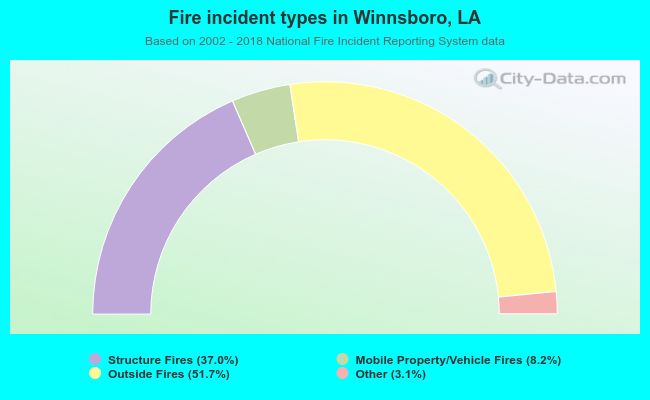 When looking into fire subcategories, the most incidents belonged to: Outside Fires (51.7%), and Structure Fires (37.0%).